Manage Dashboards
After the integration is deployed and Cyware Intel Exchange data is ingested into Google SecOps, you can import the provided dashboards to visualize the ingested indicators and correlation data. The dashboards help security teams monitor IOC ingestion, identify correlations with environment events, and analyze indicator activity across different time ranges.
Import Cyware Intel Exchange Dashboards into Google SecOps SIEM
To visualize Cyware data in Google SecOps, import the provided dashboard JSON files into Google SecOps SIEM.
Steps
To import a dashboard, follow these steps:
Log in to your Google SecOps instance.
From the navigation bar, click Dashboards under Dashboards & Reports.
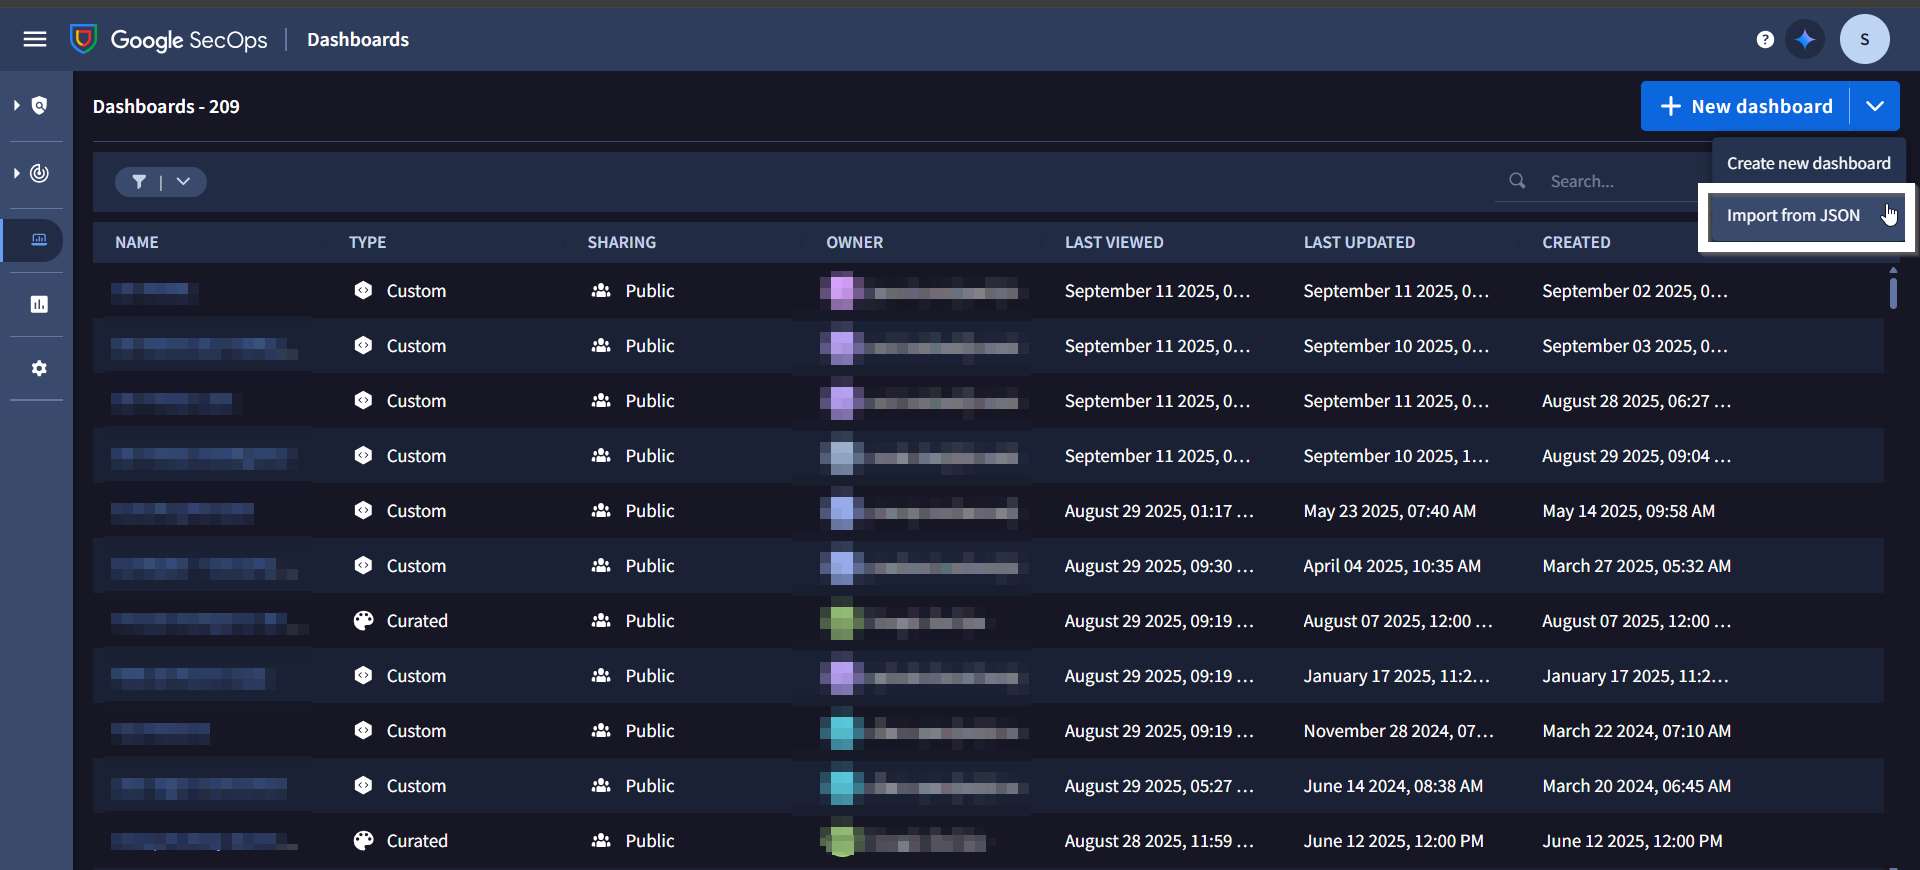
Click New dashboard, and then click Import from JSON.
In the Import Dashboard dialog box, click Upload dashboard files, and select the dashboard JSON file.
Click Import to import the dashboard into a personal or shared dashboard.
After importing the dashboard, it is available in the Dashboards section, where you can use it to monitor and analyze Cyware Intel Exchange data in Google SecOps.
View Available Dashboards
The Cyware integration provides dashboards that help visualize IOC ingestion and correlations between Cyware indicators and events observed in the environment.
The following dashboards are available:
The Correlation Overview dashboard helps identify relationships between Cyware Intel Exchange IOCs and events detected in the environment.
Note
Correlation currently supports the following IOC types:
IP address
Domain
File hashes (MD5, SHA-1, SHA-256)
Use the Global Time filter to update the panels based on the selected time range. Default value is Last 7 days.
The dashboard includes the following panels to help visualize Cyware Intel Exchange data and IOC activity:
Unique IOC Matches: Displays the number of unique Cyware IOCs that matched events in the environment within the selected time range.
Unique IOC Matches (Last 30 Days): Displays the number of unique Cyware IOCs that matched events in the environment within the last 30 days.
Unique IOC Matches (Last 7 Days): Displays the number of unique Cyware IOCs that matched events in the environment within the last seven days.
Unique IOC Matches (Last 24 Hours): Displays the number of unique Cyware IOCs that matched events in the environment within the last 24 hours.
High Severity IOC Matches: Displays the number of IOC matches where severity is High or the confidence score is greater than 69, within the selected Global Time Filter.
Medium Severity IOC Matches: Displays the number of IOC matches where the severity is Medium or the confidence score is between 30 and 69, within the selected Global Time Filter.
IOC Matches Over Time by Severity: Displays the number of IOC matches over time, categorized by severity, within the selected Global Time Filter.
Top 10 IOC Values: Lists the top 10 IOCs that repeatedly appear in IOC matches within the selected Global Time Filter. This panel helps SOC teams identify persistent or recurring indicators. It includes a drilldown option to view events that matched the selected IOC.
IOCs Matched: Provides a detailed list of all IOCs that matched events in the environment within the selected Global Time Filter. This panel includes a drilldown option to view events associated with the selected IOC.
IOCs Geolocation Overview: Displays the geographic source of the most frequent IOC matches within the selected Global Time Filter.
Number of IOC Matches by Risk Score: Displays IOC matches grouped by risk score ranges within the selected Global Time Filter:
None = 0
Low = 1–29
Medium = 30–69
High = 70–100
Number of IOC Matches by IOC Type: Displays the number of IOC matches grouped by IOC type within the selected Global Time Filter.
Use the IOCs Overview dashboard to visualize the indicators ingested from Cyware Intel Exchange into Google SecOps.
Use the following filters to refine the data displayed across the dashboard panels:
IOC Active Time: Updates the panels based on the selected time range. The default value is Last 7 days.
Tenant Name: Updates the panels based on the selected tenant name. The default value is Not null.
To filter the dashboard for a specific tenant, follow these steps:
Select the Tenant Name filter.
Set the operator to equal.
Enter the tenant name in the text box.
Click Apply.
The dashboard includes the following panels to visualize IOC ingestion and indicator status information:
Total Unique Cyware IOCs: Displays the total number of IOCs ingested into Google SecOps from Cyware within the selected IOC Active Time filter.
Total Unique Cyware IOCs (Last 30 Days): Displays the total number of IOCs ingested into Google SecOps from Cyware within the last 30 days.
Total Unique Cyware IOCs (Last 7 Days): Displays the total number of IOCs ingested into Google SecOps from Cyware within the last seven days.
Total Unique Cyware IOCs (Last 24 Hours): Displays the total number of unique IOCs ingested into Google SecOps from Cyware within the last 24 hours.
High Severity Cyware IOCs: Displays the number of IOCs where the severity is High or the confidence score is greater than 69, within the selected IOC Active Time filter. This panel includes a drilldown option to view the related IOCs.
Medium Severity Cyware IOCs: Displays the number of IOCs where the confidence score is between 30 and 69, within the selected IOC Active Time filter. This panel includes a drilldown option to view the related IOCs.
Pending Manual Review Cyware IOCs: Displays the number of IOCs that are marked for manual review in Cyware Intel Exchange. This panel helps threat intelligence and SOC teams identify indicators that require manual review. This panel includes a drilldown option to view the related IOCs.
Reviewed Cyware IOCs: Displays the number of IOCs in Cyware Intel Exchange that are reviewed within the selected IOC Active Time filter. This panel includes a drilldown option to view the related IOCs.
Actioned Cyware IOCs Displays the number of IOCs in Cyware Intel Exchange for which actions have been taken, within the selected IOC Active Time filter. This panel includes a drilldown option to view the related IOCs.
Revoked Cyware IOCs: Displays the number of IOCs in Cyware Intel Exchange that are revoked within the selected IOC Active Time filter. This panel includes a drilldown option to view the related IOCs.
Whitelisted Cyware IOCs: Displays the number of IOCs in Cyware Intel Exchange that are whitelisted within the selected IOC Active Time filter. This panel includes a drilldown option to view the related IOCs.
False Positive Cyware IOCs: Displays the number of IOCs in Cyware Intel Exchange that are marked as false positives within the selected IOC Active Time filter. This panel includes a drilldown option to view the related IOCs.
Deprecated Cyware IOCs: Displays the number of IOCs in Cyware Intel Exchange that are deprecated within the selected IOC Active Time filter. This panel includes a drilldown option to view the related IOCs.
Number of Cyware IOCs by TLP: Displays the number of IOCs grouped by TLP value within the selected IOC Active Time filter.
Number of Cyware IOCs by Severity: Displays the number of IOCs grouped by severity within the selected IOC Active Time filter.
Number of Cyware IOCs by IOC Type: Displays the number of IOCs grouped by IOC type within the selected IOC Active Time filter.
Timeline of IOCs Count by Severity: Displays the number of IOCs over time, categorized by severity within the selected IOC Active Time filter.
Number of Cyware IOCs by Country: Displays the number of IOCs grouped by country within the selected IOC Active Time filter.
Number of Cyware IOCs by Risk Score: Displays the number of IOCs grouped by risk score ranges within the selected IOC Active Time filter:
None = 0
Low = 1–29
Medium = 30–69
High = 70–100
Note
For drilldown panels, after triggering a drilldown, manually set the time range in the search to match the IOC Active Time filter defined in the dashboard. This is required due to a Google SecOps limitation, where dashboard filters are not automatically applied to drilldown queries.
If the Tenant Name filter is applied in the dashboard, ensure the following when running the drilldown query:
Keep Case Sensitivity enabled.
Add the following line at the beginning of the drilldown query and replace the value with your tenant name:
graph.entity.namespace = "your_tenant_name"