Manage Intel Repository
The Intel Repository is a centralized repository that consists of indicators from various sources, such as configured detection integrations or indicators shared by the network. Additionally, you can take action on these indicators by configuring the necessary actioning integrations and then creating playbooks. For more information about integrations in ACD, see Configure ACD Integrations.
To automate the process of receiving and actioning on indicators, you can configure automation rules and cut down the time spent manually analyzing the indicators. For more information, see Create Automation Rules.
To view the Intel Repository in the Member Portal, go to Automated Collective Defense > Intel Repository from the main menu.
The Intel Repository is divided into the following sections:
My Collection | Network Collection |
|---|---|
View all indicators that are detected by configured integrations and manually added by you. This section is further divided into:
| View all indicators shared with you by the network. This section is further divided into:
|
In My Collection, you can view and manage all indicators that are detected by configured integrations, added manually, and shared with the network.
Note
The IOC types supported for ingestion from detect integrations are IPs, domains, URLs, email addresses, and hashes. In a day, you can ingest up to 10,000 indicators (manually or using detection integrations) into the Intel Repository.
You can perform the following actions in My Collection:
To manually add indicators, click Add Indicators in the upper-right corner.
To manually share the indicators, you can hover over the indicator in the listing and click Share with Network.
View Indicator Details
Click any indicator to view basic details and related information.
Basic Details: View basic information about the indicator. The fields displayed in Basic Details are IOC type, Value, Source, Confidence Score, and more.
Enrichment Details: Before the indicator is available in My Collection, it is enriched with a tool called Pangea. The enrichment details are available in this section, which helps you gain additional context and analyze the indicator effectively.
Search and Filter Indicators
You can filter indicators using the CQL or basic search. Switch between the two options to search and filter indicators based on your preference.
CQL: Use Cyware Query Language (CQL) search to perform advanced searches that include a combination of parameters, conditions (AND, OR), and operators (=, !=, IN, NOT IN).
The supported CQL parameters in My Collection are IOC Type, Risk Score, Value, Source, Last Updated, Enrichment Verdict, Alert ID, and Alert Title.
Basic: Switch from CQL to basic search to filter by IOC Type, Last Updated, Enrichment Verdict, and Source Confidence.
In the Network Collection, you can view and manage all indicators that have been shared by the network, as well as indicators that you have actioned on.
You can perform the following actions in Network Collection:
When you share indicators with your organization (network) in My Collection, it is analyzed by the network and shared back to other members. These indicators are available in Network Collection's Received Indicators.
You can manually action on these indicators based on the configured actioning integrations.
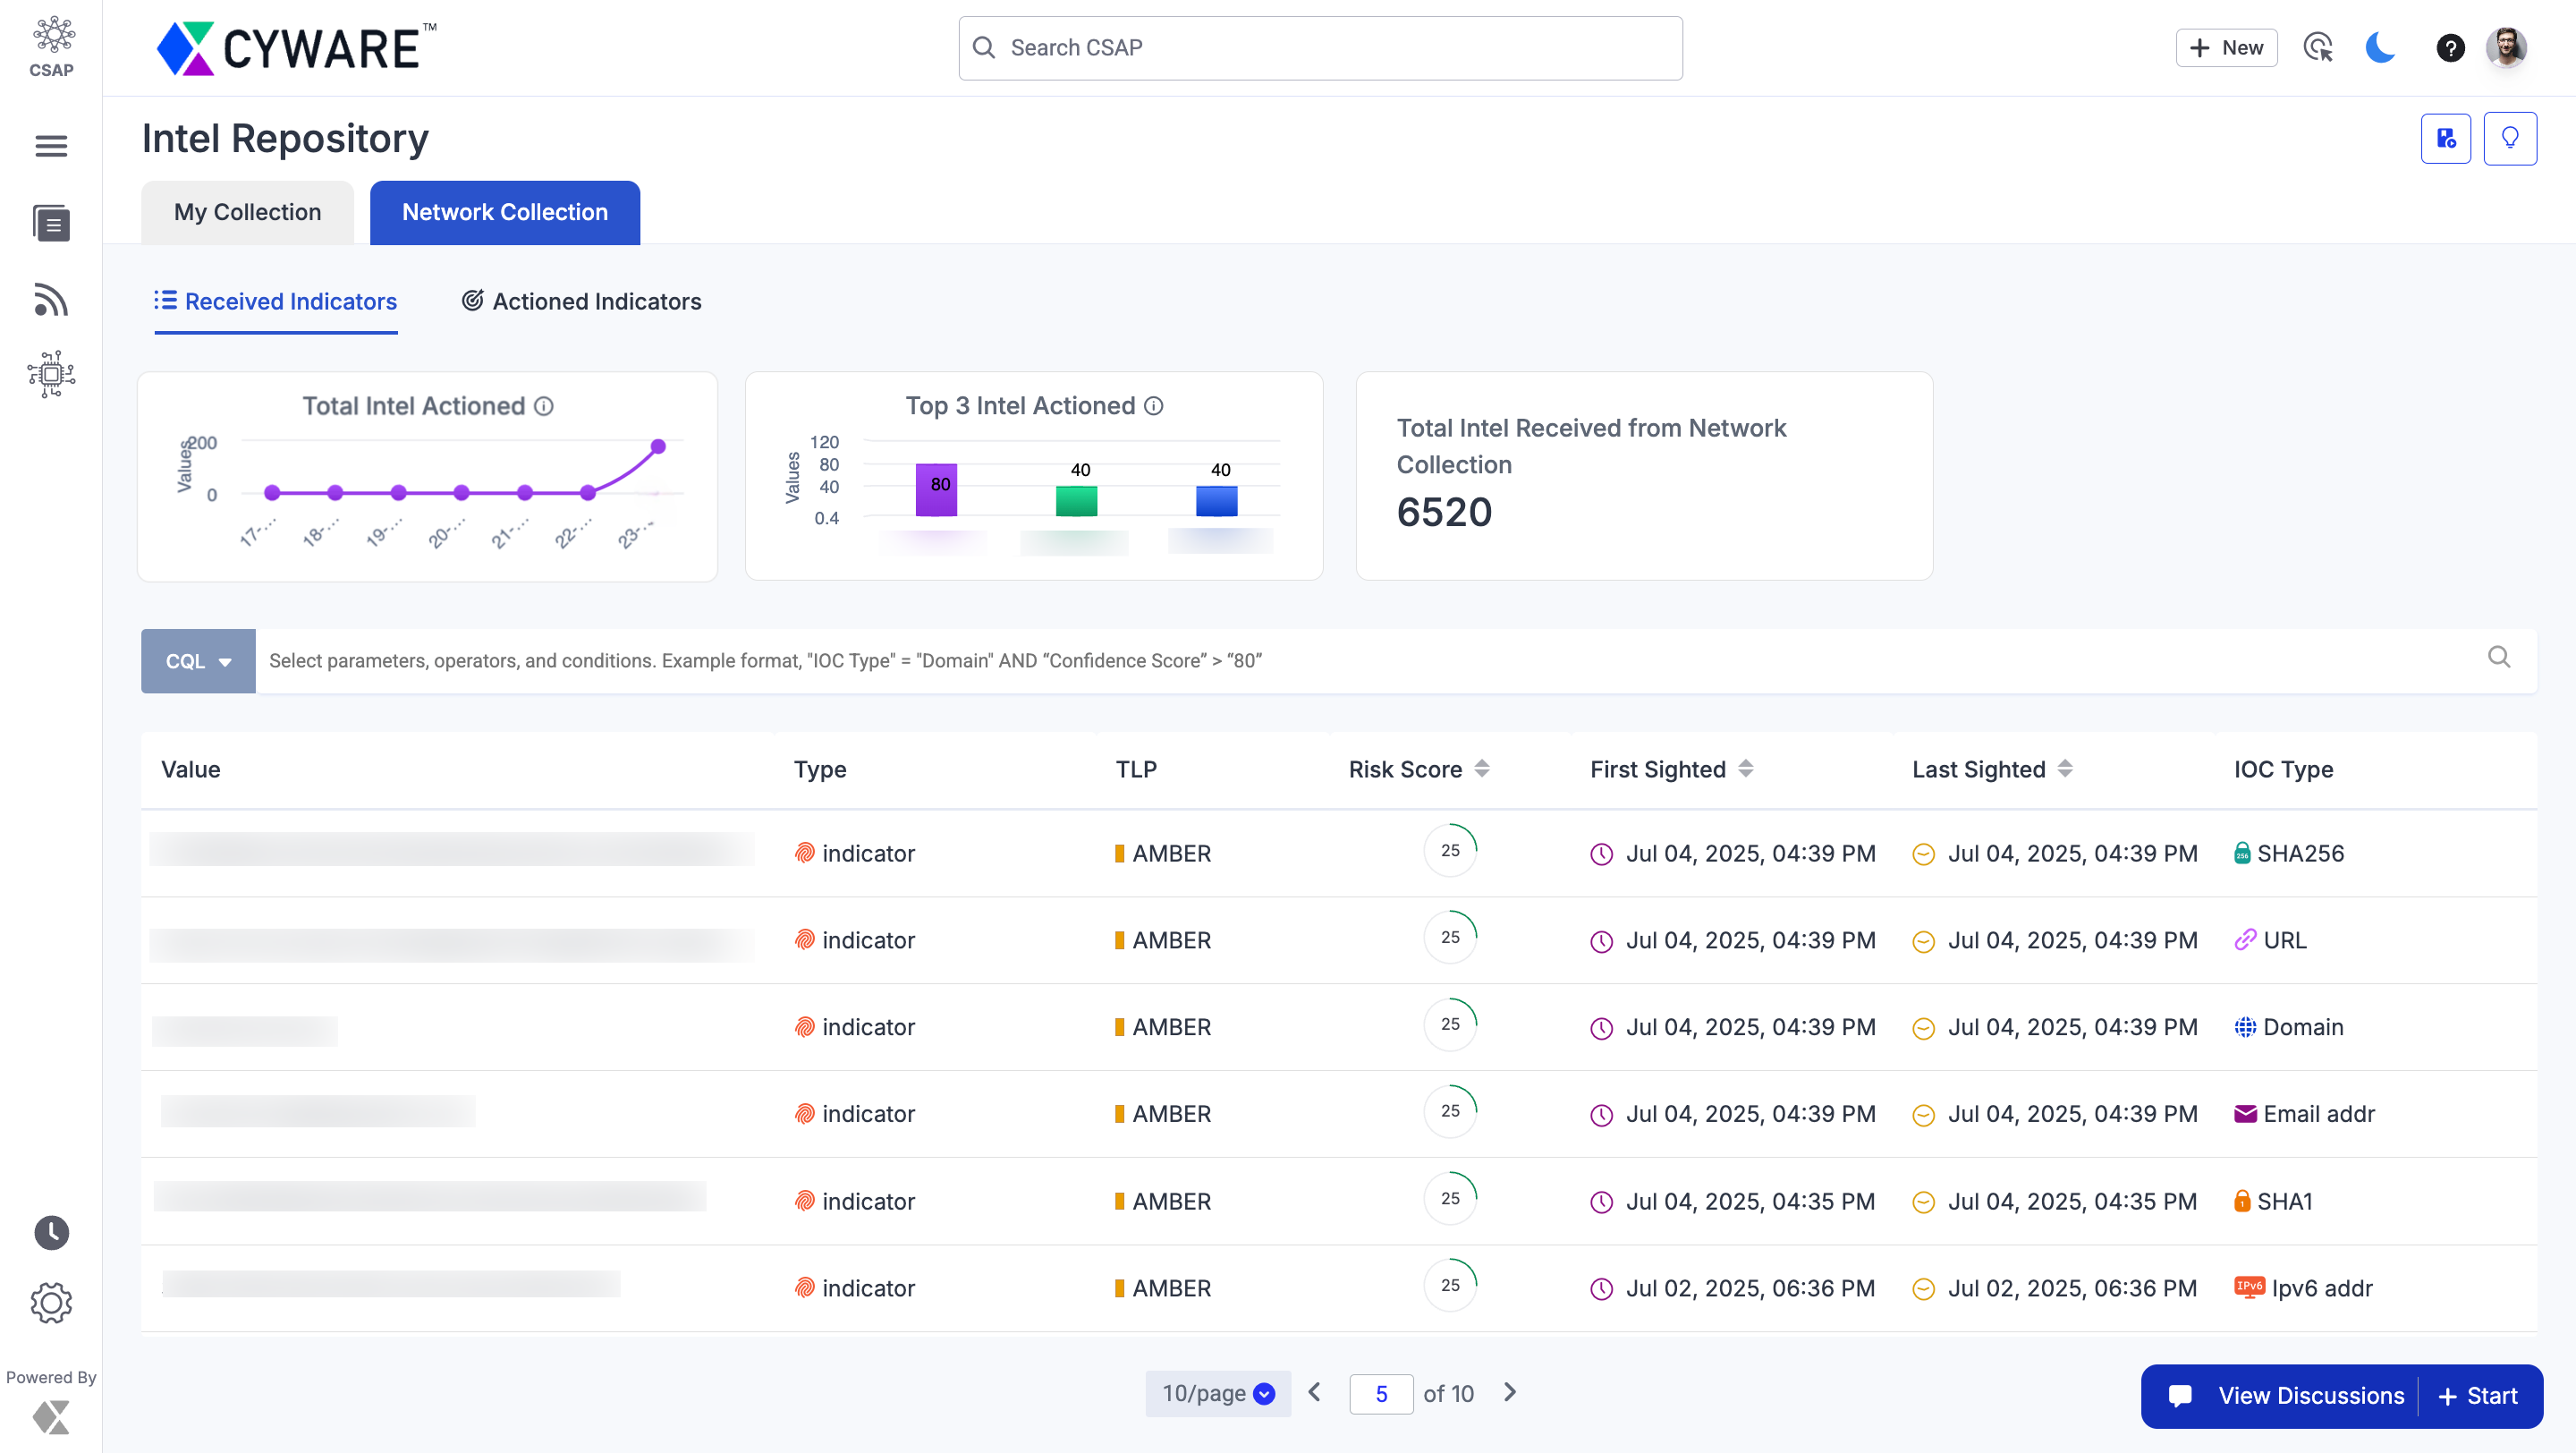
You can also view details such as the total number of indicators shared, top actions taken, and more in the form of widgets in Network Collection.
View Widgets
In the Network Collection, you can view data corresponding to intel (indicators) received from the network and actioned by you.
Total Intel Actioned: Displays the graph for the total number of indicators actioned by all organization members in the last seven days.
Top 3 Intel Actioned: Displays the top three indicators that have been actioned by all organization members in the last seven days.
Total Intel Received from Network Collection: Displays the total number of intel (indicators) that are approved and shared by the network.
The following image displays the widgets for intel in Network Collection:

View Indicator Details
Click any indicator to view basic details and related information.
Basic Details: View basic information about the indicator. The fields displayed in Basic Details are based on the type of the indicator and can vary from indicator to indicator.
Run Playbooks: View the list of actions supported by the configured actioning integrations. Click on any listed playbook to apply an action to the indicator. For example, if the IOC type is a URL and you have configured ZScaler Internet Access (ZIA) as an actioning integration, you can select the Add URLs to Blocklist action. This ensures that the URL is added to the specified blocklist in ZIA directly from Collaborate's ACD. For more information about creating playbooks, see Configure Action Integrations.
Relations: If the indicator is related or linked to other indicators, you can view the relation details in this section. You can switch between Visualizer and Table views based on your preference.
Enrichment Details: Before the indicator is available in the Intel Repository, it goes through an enrichment tool such as Pangea, which is configured by the network. These enrichment details are available in this section, which helps you analyze the indicator effectively.
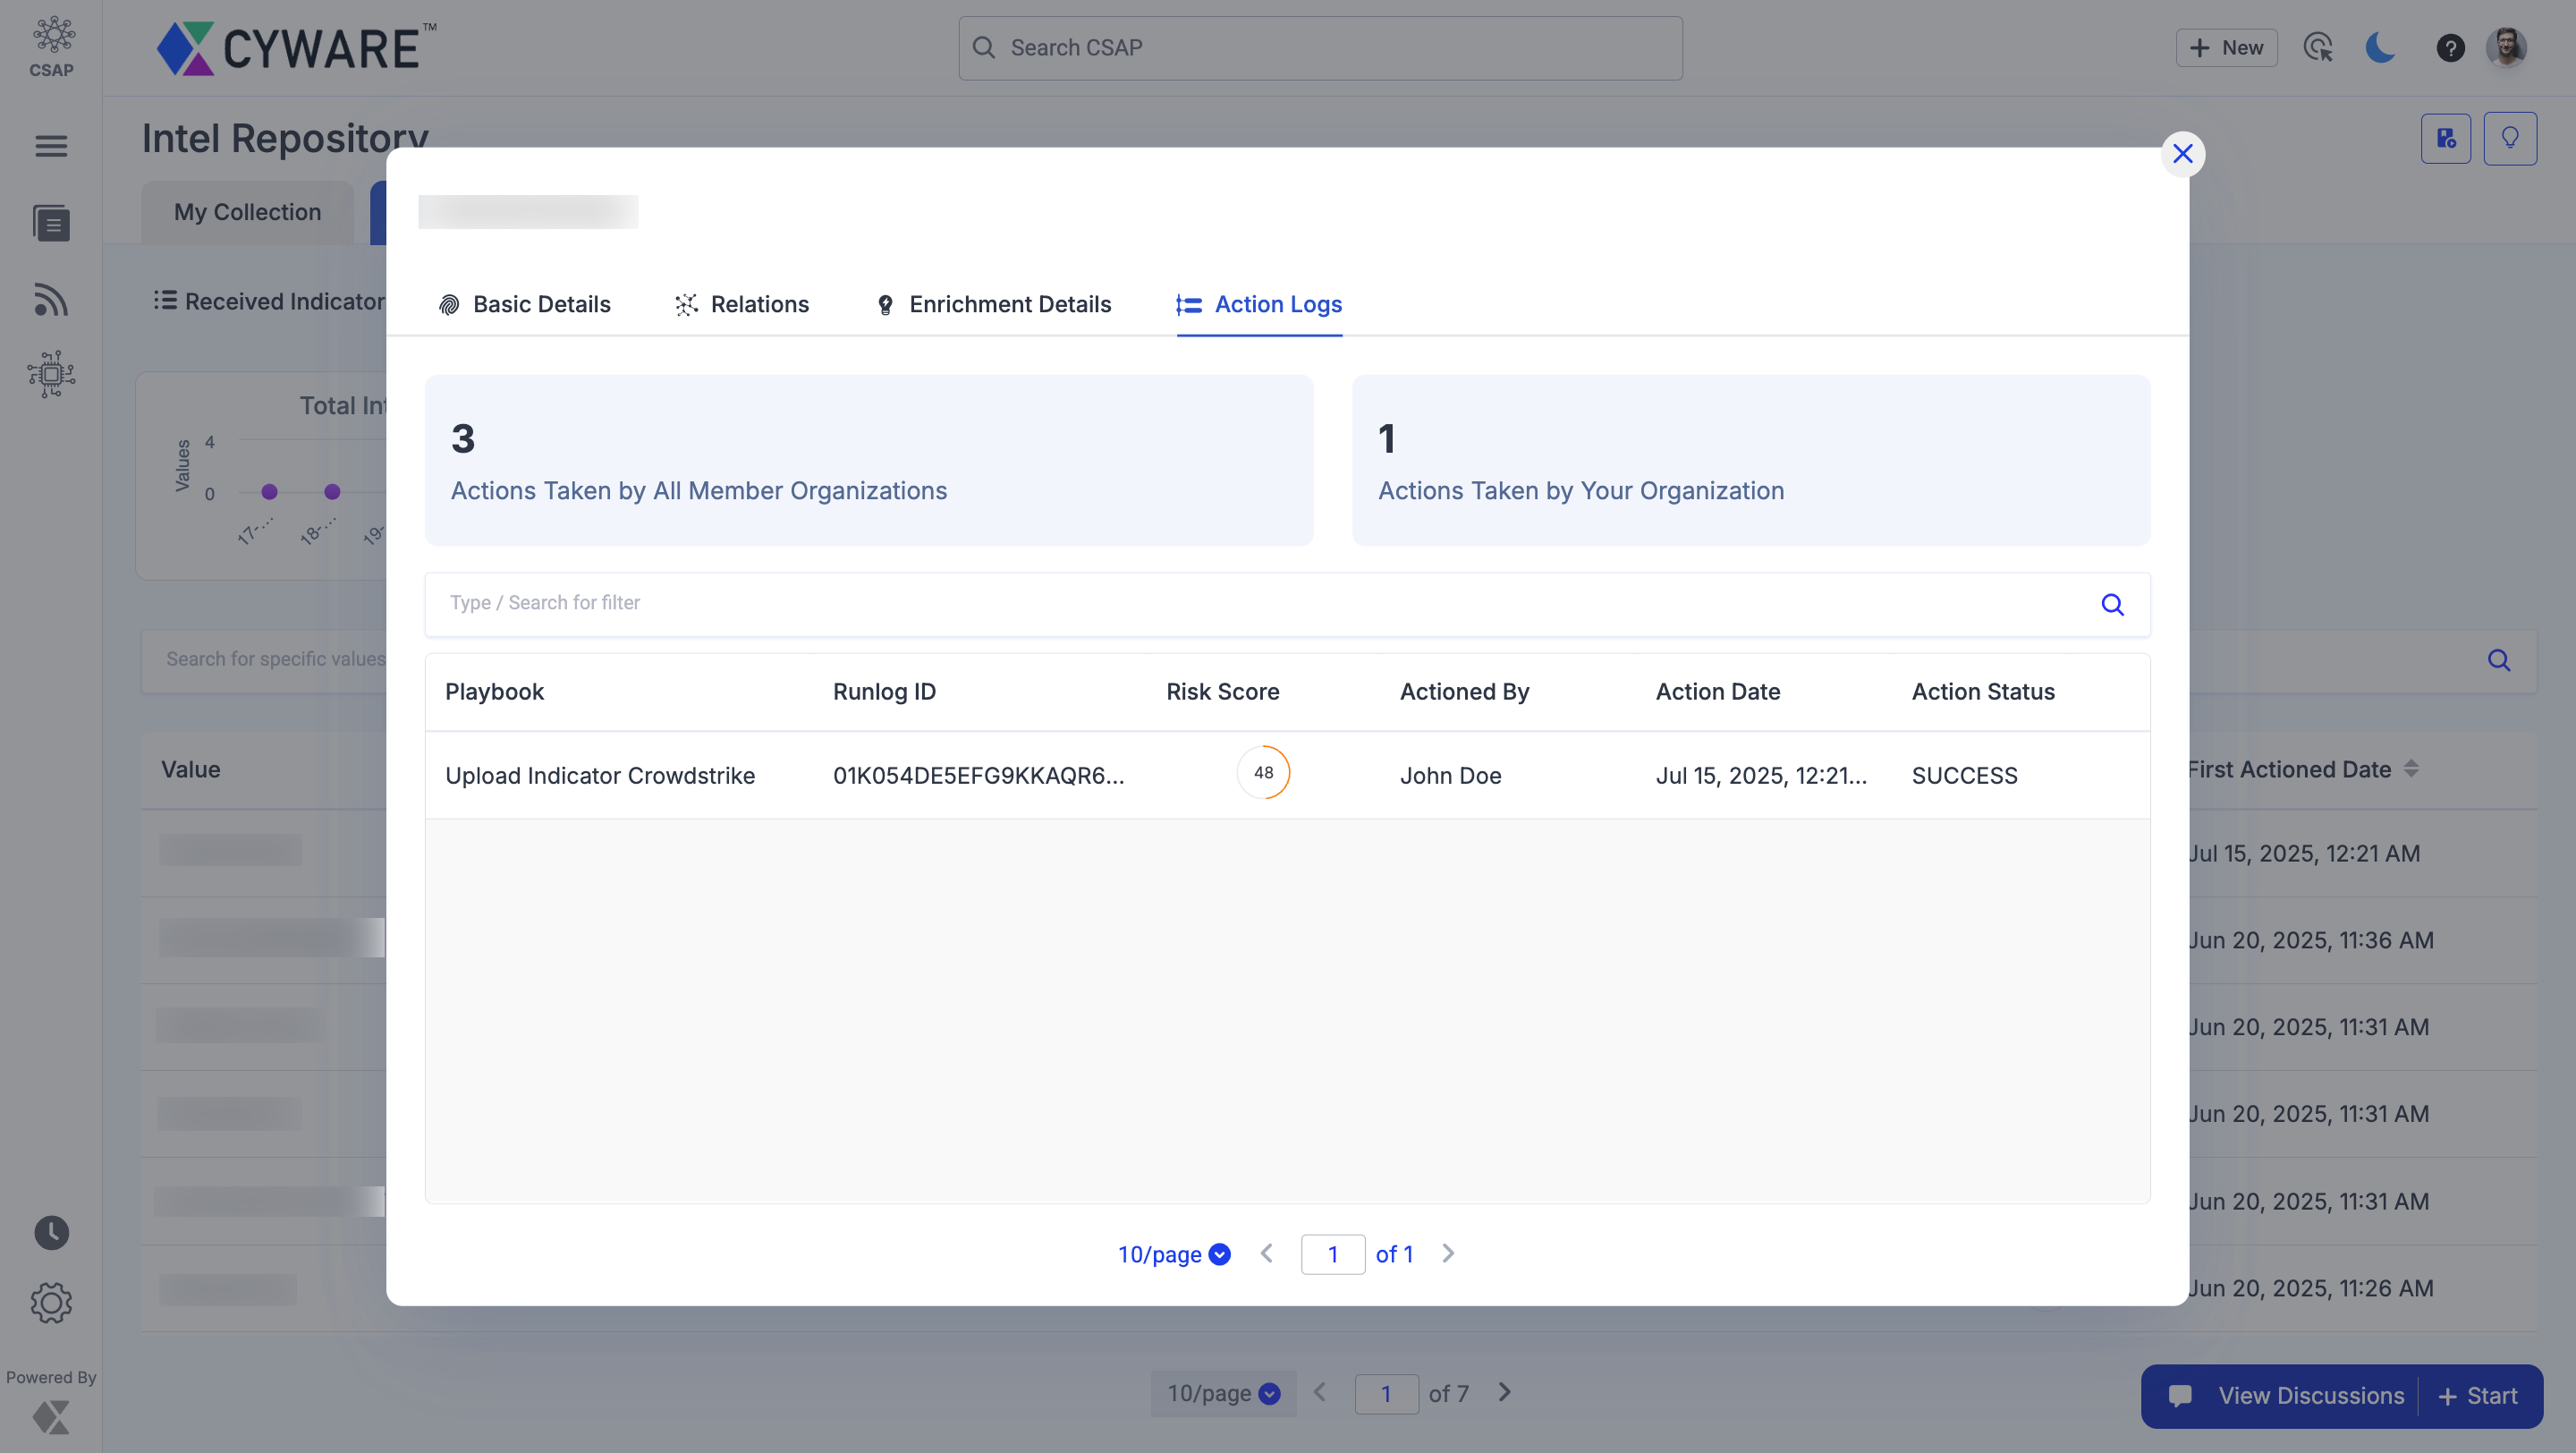
Action Logs: If the indicator has been actioned on by you or other members, you can view the logs of all actions taken in Action Logs.
If any action has failed to run, you can review the error by hovering over the action record and clicking on the Open Runlog icon.
The widgets display the total number of actions taken by all organization members on the specific indicator and the total number of actions taken by your organization.

Search and Filter Indicators
You can search and filter indicators using the CQL or basic search. In Received Indicators, you can switch between the two options to search and filter indicators based on your preference.
CQL: Use Cyware Query Language (CQL) search to perform advanced searches that include a combination of parameters, conditions (AND, OR), and operators (=, !=, IN, NOT IN).
The supported CQL parameters in Network Collection are IOC Type, TLP, Risk Score, First Sighted, Last Sighted, Valid Until, Country, and Value.
Basic: Switch from CQL to basic search to filter by IOC Type, TLP, First Sighted, and Last Sighted. In the Actioned Indicators section, you can also filter by First Actioned Date and Source Confidence, along with IOC Type and TLP.