Key Features
Learn about the key features of the Member Portal such as alerts, Threat Defender Library, RSS Feeds, and more.
Alerts
Alerts in the Member Portal are tactical, technical, or informational notifications regarding current vulnerabilities, exploits, and other security issues relevant to a product, industry, or organization. Analysts can create and share actionable alerts from the Analyst Portal and share them with you in the Member Portal.
To view alerts, go to Alerts from the left-sidebar to view alerts received in the Member Portal.
View Alerts
After you sign in to the Member Portal, you can view all alerts where you are the recipient. The alert view is divided into Alerts and Network Advisories.
Alerts: View all alerts sent to you, except for alerts from network advisory providers. You can click on any alert from the available list and view its details. Alerts can contain a variety of information, such as criticality, threat type, intel type, and many other important factors. This section details all the basic information that can be shared in an alert.
Network Advisories: View all the alerts from network advisory providers. Network advisory providers are threat intelligence vendors that share real-time security feeds with .
Note
To view the Network Advisories section in the Member Portal, it must be enabled from the Analyst Portal. For more information, contact your administrator.
Depending on the configuration in the Analyst Portal, Cyware advisories may appear either under the Alerts tab or the Network Advisories tab.
Use the following information while viewing alerts in the Mailbox layout in the Member Portal:
The main section displays the basic alert details such as the alert title, description, alert image, and TLP associated.
To quickly navigate across different sections of the alert, use the Table of Contents located in the upper-left corner next to the alert title.
If Intel Lake is enabled for you, you can click the indicators displayed in Threat Indicators of the alert for further details.
To bookmark an alert for your reference, click Bookmark in the upper-right corner. Additionally, to bookmark several alerts simultaneously, you can select multiple alerts, click the vertical ellipsis, and select Bookmark. Bookmarked alerts are accessible using the alert filters, as well as the global search.
To archive an alert, click Archive. Archived alerts are accessible using the alert filters, as well as the global search.
To export the alert you are viewing, click the vertical ellipsis in the right pane and click Export. To export all alerts, click Export Alerts in the upper-right corner.
If feedback is enabled for you by the analyst, you can provide your feedback for the alert. You can either select Like or Dislike and subsequently select the Content and Relevancy rating, and add a feedback comment. Additionally, you can resubmit your feedback, which will replace the previous submission.
Similarly, you can also share your feedback for the alert directly from the alert you receive in your email.
Note
You can only provide feedback once through email alerts, but you can submit it again through the Member Portal. Your latest feedback will be considered, regardless of any previous submissions.
To start alert or recipient group-based discussions with other members, click Start in the lower-right corner. To access ongoing discussions for the alert you are viewing, click View Discussions.
Overview
You will be presented with the Alerts module as the landing page as soon as you sign in to CSAP Member Portal. This is a default setting. The Alerts module displays a list of new Alerts that have been extracted directly from CSAP Analyst Portal. As mentioned earlier, this Alerts module can also be accessed via the left side menu.
You can change the layout of the Alerts module by clicking the Change Layouticon in the top-right corner. The following options are available:
Mailbox: Displays alerts in the format of emails, with a list of alerts on the left-hand side, and a view of the current selected alert and its associated information to the right.
Feed: Displays alerts as a continuous feed. Clicking an alert opens a dialog box, where you can view the alert and its associated information.
Card: Displays alerts as individual cards. Clicking an alert opens a dialog box, where you can view the alert and its associated information.
List: Displays alerts as a detailed list. Clicking an alert opens a dialog box, where you can view the alert and its associated information. You can choose how many alerts appear per page by clicking the drop-down menu at the bottom of the screen. Available options include 10, 20, 30, 40, and 50alerts per page.
Once you have selected your preferred layout, click Switch Layout. The layout change is applied.
Manage Alerts
As a member, you can view and manage alerts in the Member Portal.
New Alerts: View newly published and unread alerts.
Bookmarked Alerts: View bookmarked or saved alerts to easily access them in the future.
Archived: View all alerts that are read by members. Alerts are automatically archived if Auto-Archiving is enabled.
Use the following filters to filter alerts:
Channels: Channels are a collection of alerts that are automatically categorized based on a selected Information source or recipient group. Channel alerts are targeted at recipients who consider alerts shared by particular information sources valuable or important. For example, finance-related alerts can be shared only with the relevant stakeholders.
Categories: Alert categories are separate classifications of cyber or non-cyber alerts published from the Analyst Portal. Designating alerts based on an alert category can aid in the organized distribution of useful information to appropriate users within the organization. Members can select a particular category in Settings and will receive alerts from those alert categories.
Traffic Light Protocol (TLP): TLP is used by analysts to indicate how widely the information can be circulated beyond the immediate recipient group. It improves the flow of information between individuals and groups in a controlled and trusted way.
Published Date: Filter alerts based on the date of publishing. You can choose between preset dates or choose specific dates.
Followed IRs: If the Intelligence Requirements (IRs) feature is enabled for you, you can filter alerts based on the IRs that you follow.
Source: Sources are various threat intelligence providers sharing real-time security feeds. You can select multiple sources to filter the alerts within the Network Advisories section.
Recipient Groups
Members in are categorized into different recipient groups to receive targeted alerts. There are three primary categories of recipient groups (RG) - Public Groups, Invite-only Groups, and System Groups. However, a single user may be included in multiple recipient groups. Additionally, an alert may be sent out to more than one recipient group.
For example, an alert based on a particular malware targeting the finance department of an organization may be tagged to the Finance & Accounts recipient group. Similarly, the best security practices alert can be sent to all recipient groups within an organization.
The following recipient groups are supported in Collaborate:
Public Groups are recipient groups that are made available to all Collaborate members for the purpose of receiving targeted alerts based on their role in the organization. You can be part of only one public group at a time, based on your preference. While onboarding Collaborate, you are given the option to select a public group. Later, you can switch to a different public group under the app settings in the Member Portal. Based on your product plan, public groups may be enabled by default.
Invite-only Groups are the recipient groups created by analysts to meet the functional requirements of your organization. Analysts can create multiple invite-only groups and you may be included in multiple invite-only groups. You can request to join these groups in Settings > General Settings > Recipient Groups.
System Groups are recipient groups that are available out of the box. Members of Collaborate are categorized into system recipient groups based on their roles. For example, all survey requests can be tagged to the Survey Managers system groups. However, member users in these groups can be modified.
Export Alerts
As a member, you can export alerts for offline analysis and sharing in the following formats:
Export as CSV
Export as PDF
Before you Start
To export multiple alerts simultaneously in the Member Portal, the bulk alert export setting must be enabled by your administrator in the Analyst Portal. For more information, contact your administrator.
Export as CSV
Export alerts as CSV files to perform advanced analysis. For example, you can integrate the CSV exports into Security Information and Event Management (SIEM) systems for centralized monitoring.
Steps
To export alerts as CSV files, follow these steps:
Sign in to the Member Portal, and go to Alerts.
Click Export Alerts,and select Alerts.
To apply filters, use the following information:
Select Date: Choose from predefined durations such as Last 24 Hours, Past Week, Past Month, or Past 3 Months for exporting alerts. Alternatively, you can enter a custom date range in Specific Dates.
(optional) Additional Filters: Select from a range of additional filters such as channel, TLP, category, or others to further refine the details in your alert report.
Click Export as CSV.
You will receive the link to the exported file in your email from where you can download it. The link can only be used once and expires in 72 hours from the time you receive it. To download the CSV report directly from the Member Portal, go to Download History, hover over the record, and click Download.
Export as PDF
Export alerts as PDFs to document security incidents, response plans, or for knowledge sharing.
Steps
To export alerts as PDF files, follow these steps:
Go to Alerts.
Select the alerts based on your preference, click the vertical ellipsis, and select Export as PDF.
You will receive PDF attachments of the exported alerts in your email.
Note
You can export a maximum of 10 alerts simultaneously.
Select All Alerts
To select all alerts in a feed, perform the following steps:
In the Member Portal feed, select the check box associated with an alert.
A taskbar appears at the top of the feed.
In the taskbar, click the arrow icon next to the check box and then click Select All.
Note
The Select All option displays the number of current alerts in your feed, in parentheses ( ).
Archive Alerts
Archive alerts that you have read to reduce clutter and keep your workspace organized.
To archive an alert, select the alert and click Archive. Similarly, you can select multiple alerts to archive them simultaneously. To view all the archived alerts in the Mail Box and List layouts, select Add Filters > Archived. To view all the archived alerts in the Feed and Card layouts, select Archived.
Alerts are automatically archived if Auto-Archiving is enabled in the Analyst Portal. If not, then users will have to manually Archive Alerts after reading them using the Archive. Auto-Archiving and Manual-Archiving are available to you based on your organization’s subscription plan.
Threat Assessment
Threat Assessment enables security teams to quickly get a pulse of how many members are impacted by a vulnerability, malware, or threat activity. Analysts can now include Threat Assessment questions and preconfigured response options along with the Alerts published to members. Threat Assessment questions are shown on the top of the Alert in the Member portal.
RFI Alerts
Analysts can raise RFIs from the Analyst Portal directly and publish them on the Member Portal. The RFI is published on the Member Portal as an Alert. This helps the Analysts get the required information in a collaborative manner from Members receiving the RFI.
The Members receiving this RFI Alert can post multiple responses on the integrated Response Box of the Alert body.
Analysts can view the responses added by Members on the RFI Responses tab of the Alert body.
Apply Tags to Alerts
Users can see the Tags for an Alert on the right side of the Alert content. Tags can be used to group the Alerts. Users can add the Tags to their Channels and view Alerts related to a particular Tag from this section.
Activities
Click on a Tag name to view the list of all Alerts related to the Tag.
Click on Add to Channels option to add Tags from the Alert to one of your Channels. Manage Alert Channels
Create Actions from Alerts
CSAP allows users to create three types of actions.
Alert-level action: This can be created from an alert and shared only with the recipients of the alert.
Member-recommended action: Alert-level actions can be recommended to members from the same organization or alert recipients.
Analyst-recommended action: CSAP Analyst Portal users with an Analyst role can recommend Actions to alert recipients while creating an alert.
For more information, see Manage Actions.
Incident Reporting
Incidents are any event or occurrence that disrupts normal operations and compromises the confidentiality, integrity, or availability of an organization's networks, systems, and data. As a member, you can report incidents from the Member Portal.
How does it work?
When your organization identifies a cyber incident, you can report it to the security response team for investigation. After reporting the incident, you can monitor its status throughout the lifecycle to track its progress. Additionally, you can update incident details by adding revisions and collaborate with the security response team through comments. This keeps you informed and actively involved in the incident lifecycle.
Note
This feature must be enabled for you from the Analyst Portal. For further assistance, contact your administrator.
Why is it important to report an incident?
Reporting incidents promptly allows for early detection, enabling your organization to respond quickly to the incident before it causes significant damage.
Timely reporting provides important information for security analysis, aiding in understanding attack vectors, identifying compromised systems, and tracing their sources.
Incident reports identify vulnerabilities that were exploited, helping prioritize patching and remediation efforts to prevent similar incidents in the future.
Report Incident
As a member, you can report incidents through the Member Portal.
Before you Start
Ensure that the feature is enabled for you by your administrator. For further assistance, contact your administrator.
Steps
To report an incident, follow these steps:
Sign in to the Member Portal.
Go to Main Menu > Incident Reporting.
Click Report Incident and enter the title of the incident. For example, Received a phishing email.
Enter the mandatory fields and click Continue.
The incident will be created with the basic details. If required, you can fill in the additional fields and submit the report.
Manage Incidents
View and manage all the incidents reported by your organization.
View Incidents
You can view the incident submissions made by you and the members of your organization in the listing page. Through this, you can track your submissions and monitor your progress.
To view incident submissions, go to Main Menu > Incident Reporting, and use the following information:
The incident submission list displays the following information:
Title: Title of the incident.
Status: Status of the submitted incident. The security response team configures the status you view here.
Incident ID: Unique ID of the incident.
Reported on: Date and time the incident was submitted.
Reported by: Name of the member who submitted the incident.
Revisions: Number of revisions added to the incident.
You can filter the results by Status, Reported By, and Reported On. Additionally, you can directly enter your query in the search bar to filter the result.
To view the details of a specific incident, click the incident report. You can view incident details like incident ID, submitter details, and more. Additionally, you can review the incident reporting activity, including revision reports, and add comments to the incident.
Add Revision
After reporting an incident, you can add more details or update existing information by adding a revision.
Note
When you add a revision, you are not updating the main report directly but rather adding a revision report to the original reported incident.
To add a revision report, follow these steps:
Go to Main Menu > Incident Reporting.
To add a revision from the listing page, hover over the incident, click the vertical ellipsis, and click Add Revision. Alternatively, you can click the incident and click Revise Report to add the revision.
Note
You cannot add revisions to a closed incident.
Update the details and click Submit.
You can view the updated timeline in the Incident Reporting Activity, which shows the date, time, and user who revised the report.
Add Comments
After submitting your incident report, you can communicate with the security response team through comments. This allows you to ask questions or clarify details, enhancing collaboration.
To add a comment, select the incident report you want to update from the list, then enter your comment in Comments. You can also view the comments provided by the security response team here.
Intelligence Requirements
Notice
This feature is available in Collaborate (CSAP) v3.7.4 onwards and is only available for Cyware cloud-based deployments.
Currently, this feature is best supported in Light Mode.
Intelligence Requirements (IRs) are information requests that help you gain insight into a particular subject over a specified period of time. IRs guide the collection, analysis, and dissemination of intelligence to support decision-making, threat detection, and overall cybersecurity improvement within your organization.
How does it work?
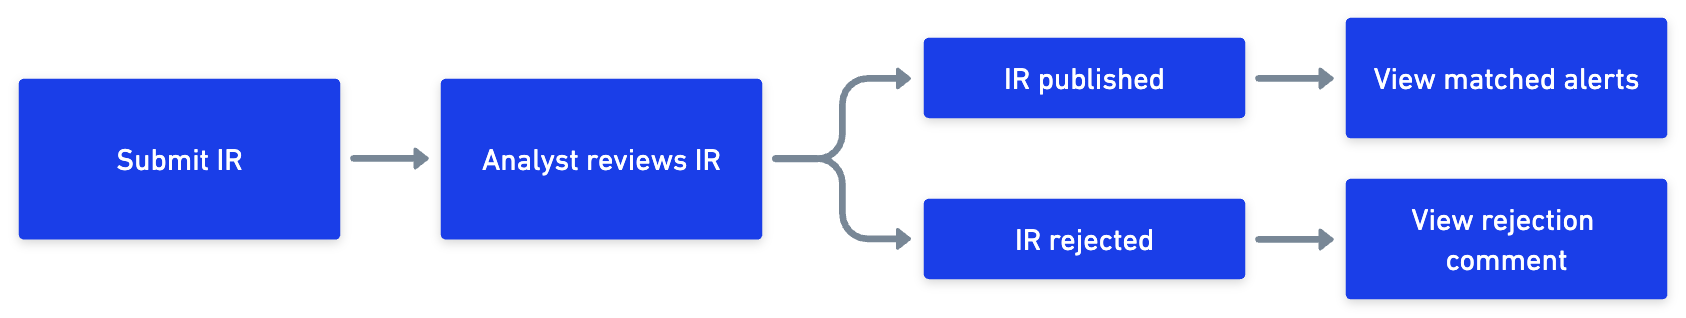
As a member, you can submit IR requests when you need specific information about a particular subject. For example, if you want to know about the phishing threat attacks in the finance industry for the next 3 months, you can submit an IR to analysts. After the IR is published, you can view matched alerts for the IR. Within the specified time period of the IR, you continue to receive alerts based on your requirements.
You can also follow IRs published in the IR Repo. The IR Repo consists of all the published IRs that are submitted by other members and published by analysts as well as IRs directly published by analysts themselves. Additionally, if you have enabled the Daily IR Report in Profile Settings > Email Subscriptions, you will receive a daily report of alerts matched in the last 24 hours with the IRs you have followed. By default, this option is enabled for you.
 |
What are the use cases of Intelligence Requirements?
IRs help you stay updated on the latest cyber threats and trends. This approach allows you to adjust your security strategies to address new challenges.
Intelligence gathered through IRs helps you leverage threat intelligence to strengthen your cybersecurity defenses, respond effectively to threats, and make informed decisions.
This feature helps you manage all your information requirements in a single place, which helps you keep track of and prioritize crucial insights.
You can use IRs to gain insights into newly discovered vulnerabilities in software, hardware, or network infrastructure. This enables you to assess exposure and mitigate risk.
What are the types of Intelligence Requirements?
General Intelligence Requirements (GIR): General Intelligence Requirements (GIR) refer to the information needs which are usually long-term and strategic in nature. GIRs are not specific to any particular threat or incident but are designed to cover a wide range of topics related to cybersecurity.
For example, a GIR might include the need for information about emerging cyber threats, industry-specific attack trends, the capabilities and intentions of known threat actors, or vulnerabilities commonly exploited by attackers.
Priority Intelligence Requirements (PIR): Priority Intelligence Requirements (PIR) are a subset of GIR that are particularly critical or time-sensitive. The identification of PIRs is driven by the current threat landscape, recent security incidents, ongoing attacks, or your organization's specific vulnerabilities. PIRs may change frequently as the threat environment evolves.
For example, you can submit a PIR for emerging advanced persistent threat (APT) groups' targeted cyber espionage activities against financial institutions.
Specific Intelligence Requirements (SIR): Specific Intelligence Requirements (SIR) are tactical information needs that are focused on addressing a particular threat, incident, or vulnerability. SIRs are more detailed and operational in nature compared to GIR and PIR.
For example, if your organization is experiencing a series of targeted phishing attacks, you can submit an SIR to gather intelligence on the sender's tactics, techniques, and procedures (TTPs) to strengthen email security measures.
Submit an Intelligence Requirement
As a member, you can submit an Intelligence Requirement to address specific cybersecurity challenges and potential threats faced by your organization.
Steps
To submit an Intelligence Requirement, follow these steps:
Sign in to the Member Portal.
Go to Intelligence Requirements from the sidebar, and click My IRs. You can view all the IRs that you have submitted here.
Click Submit IR. Use the following information while submitting an IR:
Title: Enter the IR title. For example, Phishing Campaign Targeting Employee Email Accounts.
Description: Enter a detailed description for the IR.
TLP: Select the TLP associated with the IR. The default TLP is AMBER. For more information about TLPs, see TLP Controls.
IR Type: Select the IR type to define the scope and focus of the IR. The types are GIR, PIR, and SIR. The default IR Type is General Intelligence Requirement (GIR).
Priority: Select the priority of the IR. The options are High, Medium, and Low. The default priority is Medium.
Note
After the IR is published, the selected priority appears under My Priority in the details view. Any priority selected by analysts is displayed under Priority. For more information, see Intelligence Requirements.
Category: Select the IR category. The category helps classify the intelligence requirements into relevant domains. These categories are pre-configured in the Analyst Portal.
Sub-category (optional): Select the sub-category associated with the previously selected IR category.
Tags: Enter the tags that are associated with the IR. Tags play important in IRs because you can view alerts based on similar tags in the IR. You can attach a maximum of 50 tags to an IR. Examples of tags are Phishing, Email Security, Social Engineering, and Data Breaches. To refine your search, you can use the following filter options:
Starts With: Shows tags that begin with your input.
Exact Match: Shows tags that exactly match your input.
Contains: Shows tags that contain your input anywhere within the tag name.
End Date: Enter the end date to close the IR. After the end date, you no longer receive alerts for the IR. By default, the end date is set to three months from the day of submission. The minimum end date that you can set is 24 hours from the time of submission.
Attachments (optional): Upload up to 10 files to an IR to give additional context to the IR. Each file can be of a maximum size of 10 MB.
Note
To save an IR as a draft, ensure you have entered the title because it is a mandatory field. You can find all your drafted IRs in My IRs.
Click Submit to submit the IR. After you submit an IR, the analyst reviews it in the Analyst Portal and it is published by the analyst. After the IR is published, it is available in the IR Repo, where other members can follow the IR. By default, you are following the IR if it was submitted by you and published by analysts.
View All Published IRs
The IR Repo consists of all the published IRs, either submitted by members and published by analysts or created by analysts. As a member, you can do the following in the IR Repo:
View the list of published IRs and all the information associated with them. On the landing page, you can view the total number of IRs published. You can also view statistics in the form of widgets for the most-used or popular IR categories as well as the most followed IRs by members. Click Hide Widgets in the upper-right corner to close the widgets.
Note
Click the details in the widgets to know all the IRs and categories associated.
Use the filters to view IRs based on categories, TLP, priority, type, my priority, and more. You can also view the list in ascending or descending order of category, type, TLP, and popularity.
Use the Status filter to view IRs that are published or closed.
Click the IR to view the complete details of the IR. Additionally, you can click Follow to follow the IR. After following an IR, you can view all alerts that are associated with the IR based on tags. In the IR details, you can also view the alerts that match the IR.
If you have enabled the Daily IR Report in Profile Settings > Email Subscriptions, you will receive a daily report of alerts matched with the IRs you follow. The email time is based on the configuration in the Analyst Portal.
Manage IRs
As a member, you can perform multiple actions such as following, unfollowing, deleting IRs, and setting IR priority. Use the following information while managing IRs:
To follow or unfollow multiple IRs simultaneously in IR Repo or My IRs, select the IRs and click Follow IR or Unfollow IR respectively. You can only follow and unfollow published IRs.
To set your personal priority, click on the IR and choose a priority from the My Priority dropdown. This priority is different from the Priority field. For more information, see Intelligence Requirements.
To delete multiple IRs simultaneously from My IRs, select the IRs, and click Delete. You can only delete draft IRs.
Note
You can select up to 50 IRs simultaneously for bulk actioning.
Intel Operations (Cyware Orchestrate)
Note
This feature is available in v3.8.8.1 onwards.
With Intel Operations (Cyware ), you can centralize threat intelligence from multiple sources and automate the response to security threats and vulnerabilities. helps operationalize threat intelligence by automating collection, enrichment, analysis, and response across your security operations. You can access Intel Operations from the Main Menu.
Note
To use this feature, it must be enabled from the Analyst Portal. For more information, contact your administrator.
How does Cyware help you operationalize threat intelligence?
Cyware brings automation and orchestration capabilities to your threat intelligence operations, helping your team respond faster and more efficiently to security incidents. With , you can create actionable playbooks, streamlining your security processes.
supports the following key capabilities:
Playbooks: Automate and orchestrate security operation workflows with a manual or fully automated sequence of actions.
Labels: Add labels to events and playbooks to automatically trigger a playbook when the event occurs.
Run Logs: Review playbook execution details to analyze nodes and troubleshoot errors.
Apps: Connect with various security tools and data sources using prebuilt integrations to enrich your workflows.
Trigger Events: Create trigger events and run playbooks by assigning the same label to both the event and the playbook.
Configure Triggers: Configure triggers to automatically run a playbook when an event occurs in or on any external platform.
Webhooks: Use token-based URLs to securely send or receive data from external systems, enabling real-time event-driven automation.
Cyware Agent: Install Cyware Agent to enable organizations with on-premise applications to access features hosted on the cloud. For example, if is cloud-hosted and your SIEM application is on-premise, you can use Cyware Agent in a playbook to execute actions on the SIEM.
Note
Cyware Agent is available in v3.8.9.1 onwards.
Usage: Monitor your monthly action executions, view usage trends by playbooks or actions, and manage plan limits and tenant details.
Note
Usage is available in v3.8.9.1 onwards.
For more information, contact Cyware support.
Digital Risk Protection
Notice
This feature is available in Collaborate (CSAP) v3.7.6 onwards.
Digital Risk Protection (DRP) is a proactive approach to cybersecurity that involves monitoring, threat identification, and threat mitigation. In Collaborate (CSAP), the DRP feature helps you comprehensively monitor your organization's digital presence, which includes websites, domain registrations, and other online assets. This monitoring will help you identify potential risks such as domain infringement, leaked credentials, and more.
How does it work?
Analysts can configure supported integrations for Digital Risk Protection in Collaborate's Analyst Portal. As a member, these integrations are available for you in the Member Portal in Digital Risk Protection.
Note
You can view this feature in the Member Portal if it is enabled for your organization. For more information, contact your Collaborate administrator.
What are the use cases of DRP?
By continuously monitoring your domain for DRP threats, you can protect your organization against any security threats that target your brand or protect it from other digital risks.
Identify compromised employee credentials or leaked login information. This helps you take action to secure affected accounts and prevent unauthorized access.
Using incident reports, respond rapidly to any identified cyber threats. By integrating DRP into your incident response procedures, you can streamline your response efforts and respond to threats faster.
Stay ahead of emerging cyber threats by continuously monitoring your digital environment for potential risks and vulnerabilities.
View Incident Reports
Incident reports give you detailed information about security incidents that have occurred in your organization. These reports play an important role in helping you understand, respond to, and mitigate the impact of security incidents. Incident reports in DRP consist of the following information:
You can view the description of the incidents in Analysis. This includes details such as when the incident occurred, and how it was discovered. This data is directly sourced from the configured integration.
You can view all attachments associated with the incident in Attachments. You can choose to download them for your reference.
Use Search or click Filters to view reports based on category, incident type, report type, severity, and status.
View Credential Watchlists
Monitor and track compromised or potentially compromised user credentials, such as email addresses and passwords, from internet sources such as the dark web. This approach helps you identify security threats and take appropriate actions to protect your digital assets. Credential watchlists in DRP consist of the following information:
View all credential-related information such as the password, status, detection date, and more.
Switch between standard and JSON view based on your preference.
Use Search or click Filters to view credential details based on their status (addressed and compromised).
View Domain Watchlists
Use DRP in Collaborate to monitor specific domains of your organization. This helps you identify domains that may be involved in cyberattacks, such as phishing, malware distribution, or data breaches. Domain watchlists in DRP consist of the following information:
View all domain-related information such as the detection date, extraction date, and more.
Switch between standard and JSON view based on your preference.
Use Search or click Filters to view domain details based on their status (monitored and reported).
View Dashboards
Utilize visual representation of data received from supported integrations using dashboards.
You can select the date range to view relevant data.
Click View All to view detailed information for each widget.
You can also choose to change the layout of each widget.
Security Workbench
Notice
This feature is available in v3.8 onwards and only for Cyware cloud-based deployments. To enable this feature, contact your administrator.
's Security Workbench offers a range of cybersecurity tools and resources to enhance your security operations.
Tools
The following tools are supported as part of the Security Workbench:
The Fang Defang tool in is used to neutralize or defang IOCs. It changes the format of the IOCs, which facilitates secure sharing and analysis. Similarly, you can also fang data that is defanged.
Use the following information while using the Fang Defang tool in :
To manually fang or defang indicators, enter indicator data and click Fang or Defang respectively.
To upload a file of indicators to be fanged or defanged, click Upload. The supported file formats are .json, .xls,.txt, .xml, and .csv and the maximum file size is 10 MB.
To download a CSV report of fanged and defanged data, click the ellipsis and select Download.
A CVSS calculator assesses and quantifies the severity of security vulnerabilities using the Common Vulnerability Scoring System. It assigns a numerical score based on factors such as impact and exploitability, which helps you prioritize and address security issues. You can use the CVSS calculator in Collaborate to analyze the severity of vulnerabilities for timely mitigation.
Use the following information while using the CVSS Calculator:
Switch between CVSS 3 and CVSS 2 formats based on your preference.
Select the values for all metrics of your choice. Ensure you select values for all the mandatory metrics for the Base Score. After selecting values for the metrics, click Show Scores. The scores are now available for your reference.
To generate a new set of scores, click Reset Scores.
The Structured Threat Information eXpression (STIX) Converter is a tool that converts different versions of STIX data. STIX is a standard language for expressing and sharing cybersecurity threat information, and the converter facilitates compatibility between different versions of this standard. supports the conversion of versions 1.x, 2.0, and 2.1.
Use the following information while using the STIX Converter:
To manually convert data into the supported formats, enter the STIX data, select the format, and click Convert.
To upload a STIX file for conversion, click the ellipsis, and select Upload. The supported file format for STIX 1.x is .xml. For STIX 2.0 and 2.1, the supported file format is .json. The maximum file size supported is 10 MB.
To download a CSV report of the converted data, select Download.
The Encode-Decode: Base64 tool performs Base64 encoding and decoding. Encoding converts binary data into a text-based format while decoding reverses this process. This contributes to secure data handling, analysis of encoded information, and addressing challenges associated with transmitting binary data in text-based systems.
Use the following information while using the Encode-Decode: Base64:
To encode or decode binary data, enter the binary data and click Encode or Decode.
To download a CSV report of the encoded or decoded data, click the vertical ellipsis, and select Download.
The SPDX Converter in Collaborate supports converting SPDX to STIX and Common Security Advisory Framework (CSAF).
Converting SBOM to STIX helps you have improved visibility into the security posture of software components, streamlined integration with threat intelligence platforms, and enhanced collaboration. In Collaborate, the SPDX data is converted to STIX 2.1 format.
Converting SPDX to CSAF VEX is beneficial for streamlining the communication of security-related information, and ensuring compatibility with widely adopted standards and tools in the cybersecurity domain.
Use the following information while using the SPDX Converter:
To convert data SPDX data into STIX or CSAF VEX formats, enter the data and click Convert.
To download a CSV data report, click the vertical ellipsis and, select Download.
Resources
You can access resources such as the Threat Response Docker, CyTAXII, Cyware's Contribution to MITRE CAR, Cyware Threat Feeds, and Cyware Social as part of Community Offerings in .
Threat Response Docker: Cyware Threat Response Docker enables you to collect, extract, and analyze threat intelligence, while also offering OSINT capabilities.
CyTAXII: Interact with TAXII servers using CyTAXII, an open-source Python library. It allows you to consume threat intelligence from various sources in STIX format and contribute intel to a TAXII server collection.
Cyware's Contribution to MITRE CAR: Improve detection mechanisms using Cyware's Cyber Analytics Repository (CAR) project. It is a repository that offers a list of security hypotheses and simulated attacks.
Cyware Threat Feeds: Get real-time insight into global threat data through Cyware's Threat Intelligence Feeds.
Cyware Social: Stay informed about the security landscape with Cyware Social. Access the latest security articles authored by analysts and receive top security updates from third-party sources.
Click Learn More to explore these resources in detail, based on your preference.
Threat Defender Library
Notice
This feature is only available for Cyware cloud-based deployments
Threat Defender Library (TDL) is a repository that helps you utilize content for threat detection, analysis, and response. In Collaborate, TDL serves as a repository for collecting and distributing this threat defender content, enabling you to respond to threats faster and with greater accuracy.
You can create, upload, manage, and share files such as:
SIEM rules files, for example, Splunk, Devo, and Sigma
Threat detection files, including YARA Rules, log sources, Suricata, Snort Rules, and more
Analytics files such as Cyber Analytics Repository (CAR) reports
Playbooks
How does it work?
TDL simplifies the process of creating, sharing, and collaborating on threat defender rules and content.
Let us take an example of a Snort detection rule and see how TDL helps you, as a member, respond to threats faster:
Create a Snort rule and share it as a preview with other members for feedback. The following Snort rule creates an alert in the IPS system when it identifies a TCP connection with a payload with a specific sequence of bytes (in this case, the string “ZOOM”).
alert tcp any any -> any any (msg:”Possible Zeus Botnet C&C Traffic”; flow:established,to_server; content:”|5a 4f 4f 4d 00 00|”; depth:6; sid:1000005; rev:1;)
To create TDL content, see Create TDL Content.
If the peer review step is enabled, you can share the content with other members (peers) of your organization for peer review before submitting it for analyst review.
After the content is reviewed and approved by analysts, it is available in the Shared Repo of the TDL and can be utilized by members.
Analysts can also publish and share the TDL content with other member organizations to help them in the detection of the Zeus Botnet.
What are the use cases of Threat Defender Library?
Security teams often face challenges in establishing consistent detection and containment processes, resulting in slower incident response and reduced effectiveness. TDL simplifies this by providing verified content and facilitating the sharing of important detection files like Yara, Snort, and Suricata, which significantly enhances threat detection capabilities and overall incident handling efficiency.
Creating defender content often requires specialized knowledge and adherence to specific formats, which can hinder efficient content creation. TDL overcomes this challenge by allowing you to easily create content without additional expertise. You can either upload supported files for validation or use the versatile code editor to streamline content creation.
Existing SIEM detection rules are confined within vendor or platform-specific silos, posing challenges when it comes to sharing them with the broader cybersecurity community. TDL solves this by letting you create and distribute verified SIEM rules across the cybersecurity community, ensuring agility in responding to evolving threats. Additionally, you can use these rules to publish Collaborate alerts for quick action in SIEM or XDR tools.
Security teams require rapid threat detection and mitigation to prevent damage. They take actions like isolating systems, deactivating compromised accounts, and blocking malicious network traffic. Sharing TDL content or attaching it to alerts allows quick access to validated information enabling swift responses to common and organization-specific threats.
Utilize the publicly available information from the open-source OSINT repository to create TDL content for known threats. The availability of OSINT content is managed from the Analyst Portal.
TDL Repositories
The content in the Threat Defender Library (TDL) is organized into the following four repositories:
My Repo | Contains the content you have created. The content in this section has statuses such as Draft, Shared as Preview, Under Peer Review, Under Analyst Review, Declined by Peer, Declined by Analyst, Published, and Expired. |
My Org Repo | Contains the content created by other members of your organization in the Member Portal. The content in this section can contain statuses such as Shared as Preview, Under Peer Review, Under Analyst Review, Declined by Analyst, Declined by Peer, Expired, and Published. |
Shared Repo | Contains the content that is published and shared with you by analysts. |
OSINT Repo | Contains external content created by open-source repositories. Open-source intelligence (OSINT) is the intel produced by collecting, evaluating, and analyzing publicly available information with the purpose of answering specific intel queries. The availability of OSINT content in the Member Portal is managed by analysts. |
TDL Statuses
The TDL content organized in My Repo, Analyst Repo, Members Repo, and OSINT Repo can have the following statuses:
Draft | This status indicates content drafted by you in My Repo. |
Shared as Preview | This status indicates that the content is shared as a preview with peer members from the same organization. Members who are part of your organization can view the content shared for preview in My Org Repo. |
Under Analyst Review | This status indicates that the TDL content is shared with analysts for review. After approval, analysts can publish the content to recipient groups and individual recipients. The TDL content with Under Analyst Review status is available in My Repo and My Org Repo. |
Under Peer Review | This status indicates the content is shared for peer review with members of your organization. Members who are part of your organization can view and review this content in My Org Repo. |
Declined by Analyst | This status indicates content that is declined by the analyst after review. The review approval process allows members to submit TDL content to analysts for approval. If analysts find the content to be incorrect or not relevant, they can decline the content with a comment. The TDL content with the status is available in My Repo and My Org Repo. |
Declined by Peer | This status indicates content that is declined by other members of your organization after review. Other members can review your content when the peer review step is configured in the Analyst Portal. The TDL content with the status is available in My Repo and My Org Repo. |
Published | This status indicates content published by analysts. The TDL content with this status is available in Shared Repo. |
Expired | This status indicates content that is expired by analysts and members. As a member, you can only expire content that you create. The TDL content with this status is available in My Repo and My Org Repo. |
Create TDL Content
You can create content in the Threat Defender Library (TDL) using different methods depending on the type of content. You can use the following methods to create content in TDL:
Upload Files: You can upload files to TDL in formats such as YML, YAML, YAR, YARA, and more. To view validated content examples for all the supported file formats, see TDL Content Examples.
Create content using code editor: You can create and validate content using the built-in code editor and file validator. You can create content in formats such as YML, YAML, YAR, YARA, SPL, RULES, JSON, and ZEEK. To view validated content examples for all the supported file formats, see TDL Content Examples.
Create content by selecting a category: You can create TDL content by selecting a content category. This makes TDL content creation easier without technical expertise and makes it more accessible to a wide range of users. The content creation form provides a list of categories widely used by security analysts for threat detection and response. You can select from the supported categories to create TDL content. For more information, see TDL Content Categories.
Before you Start
The recipient groups you are part of must have permission to create TDL content. For assistance, contact your Collaborate administrator.
Steps
To create TDL content, follow these steps:
In the Member Portal, click Threat Defender Library in the sidebar.
Click Create Content. Use one of the following methods to create TDL content:
Drag and drop the files or click Browse to upload the files. You can upload a maximum of 10 files, and the maximum size limit for each file is 2 MB. For content examples of the supported file formats, see TDL Content Examples.
After you upload files, you can view the file name, size, and title of uploaded files. The displayed title is based on the title in file content. Click Edit to modify the details of the uploaded files. For more information about the file fields, see step 3.
In the Write Code section, select a file category for the content you want to create. For example, Threat Detection (YARA Rules).
Select a file extension for the file category. For example, yara. You can select file extensions based on the file category you select.
Click Go to open the code editor. The following code is an example of a detection YARA rule:
rule blackhole2_jar : EK
{
meta:
   author = "John Doe"
   date = "2016-06-27"
   description = "BlackHole Exploit Kit Detection"
   hash0 = "sfhbdkblSKDJHBADKBAD"
   sample_filetype = "unknown"
   yaragenerator = "https://github.com/Xen0ph0n/YaraGenerator"
strings:
   $string0 = "k0/3;N"
}
Click Validate to verify the format of the content. Refer to the validated content examples for all the supported file formats to create content in a valid format.
Click Save Changes, and enter a name for the file. For example, Blackhole Exploit Kit Detection.
Click Save.
The page displays the file name, size, and title of newly created content. The title is retrieved from the file content. If there is no title provided, then a default file name is auto-populated. Click Edit to modify the details of the code. For more information about the fields, see step 3.
In the Select Content Category, select a category for the content you want to create and click Go. For example, Threat Detection (SNORT/Suricata).
The page populates the fields for the selected category. This includes basic details such as the title, description, and ATT&CK tactic-technique pairs. For more information about the fields, see step 3.
Use the following information while creating content:
Title: The uploaded content in TDL automatically retrieves the title from the file content. You can modify the title as required. For example, Detect Intrusion: Zeus Botnet C&C Traffic. The title is used to identify the uploaded file and its related details.
Description: The uploaded file automatically retrieves the description from the file contents. You can modify the description as required. For example, The below Snort rule creates an alert if it sees a TCP connection with a payload with a specific sequence of bytes (in this case, the string “ZOOM”).
Use the Matrix, Tactic, and Technique options to add the tactics, techniques, and sub-techniques used by the threat actors. This helps you map the threat to the ATT&CK Navigator dashboard and predict the attacker's behavior. You can map multiple tactic and technique pairs by clicking More.
Code Preview: The code editor shows the file contents in text view. Use the following information to modify the file content.
Use Edit to modify the content of the uploaded file.
Use Copy to copy the content of the uploaded file to the clipboard.
Use Expand to switch focus to the code editor by expanding the code editor.
Use Download to download the file content to your computer.
Additional Information: Enter additional information to the content. The fields for additional information are automatically populated based on the uploaded file format or selected content category. For example, log sources can be additional information for SIEM-related files. The log sources have security-based logging information for detecting and investigating security threats.
Click Save as Draft to save the file as a draft in My Repo. You can make changes to the draft file before sharing it for preview or publishing.
Click Share as Preview to share your file as a preview with other members of your organization. The content is shared for preview and is available in My Org Repo by other members of your organization.
Click Submit for Analyst Review to submit the content for analyst review. If analysts approve and publish this content, it is available in the Shared Repo of the Member Portal. If the peer review step is enabled, then you can submit content for analyst review only after peer review.
If the peer review step is enabled for you, click Submit for Peer Review to submit the content to your organization members for peer review. Peer members can subsequently submit the content for analyst review. For more information about the review process, see the Peer Review TDL Content.
Peer Review TDL Content
The Threat Defender Library (TDL) provides a collaborative workflow for analysts and members to review TDL content. If analysts have enabled the peer review step, you can first submit TDL content to peer members. Peer members can subsequently submit the content (which has the Under Peer Review status) for analyst review.
If the peer review step is not enabled, you can create TDL content and directly submit it to analysts for review. Analysts can review the submitted content which has the Under Analyst Review status.
As a member, you can view all content submitted for peer review by going to Threat Defender Library > My Org Repo.
Use the following information while peer-reviewing content submitted by members in TDL:
Select the content with Under Peer Review status.
Review the content and click Submit for Analyst Review to submit the content to analysts. Analysts can subsequently approve and publish the content, or decline it. Published content is available in Shared Repo. If the content is declined by analysts, the status of the content becomes Declined by Analyst. Members can then view the content along with the decline comment in My Org Repo.
If the content is not relevant, click Decline and specify the reason for declining the content. If the content is declined by you, as a peer, the status of the content changes to Declined by Peer. Members can then view the content along with the decline comment in My Org Repo.
Manage TDL Content
The Threat Defender Library (TDL) enables you, as a member, to efficiently organize content into four distinct sections which helps you access the content you have created, published by your peers, and shared for review. You can also access open-source resources in the OSINT Repo.
Use the following information to know more about the supported options to manage TDL content. Hover over TDL content from the list to see the following options:
View: View TDL content details by either clicking View or by directly clicking the content from the list.
Edit: Edit the TDL content you have created which has the Draft or Shared as Preview statuses.
Clone: Create a copy of already existing TDL content. This helps you create content based on existing information.
Delete: Delete content from the library. Deleting content permanently removes it from the library. You can only delete content with the Expired status that you have created.
Expire: Expire outdated TDL content created by you. Expiring content does not permanently remove the TDL content from the library, but the content status is marked as Expired. Other members can still view and clone expired content in TDL.
Comments: Hover over the icon to view the reason provided by peer members or analysts for declining the content submitted for review.
View TDL Content
In the Threat Defender Library (TDL), you can view content created by you, content created by other members of your organization, content shared by analysts, and OSINT repository content.
The widgets in the TDL listing page display the count of content according to their statuses such as Draft, Shared as Preview, Under Peer Review, Under Analyst Review, Declined by Peer, Declined by Analyst, Published, and Expired. For more information about the content statuses, see Threat Defender Library.
Use the following information to view TDL content:
You must have the necessary permissions to view TDL content. For assistance, contact your Collaborate administrator.
Click Threat Defender Library on the sidebar. Click the content from the list, or hover over the content, and click View.
After you click the content, you can view the details and code preview, if available. Use the following information to manage the code preview:
Click Download to download the code locally to your computer.
Click Copy to copy the code to your clipboard.
Click Expand to expand the code preview.
To view related TDL content based on the MITRE ATT&CK framework, click any tactic, technique, or sub-technique in the content details.
To access the TDL Heat Map in the ATT&CK Navigator, click Go to ATT&CK Navigator in the upper-right corner. The TDL Heat Map gives you a visual representation of TDL content associated with tactics, techniques, and sub-techniques.
Edit TDL Content
You have the ability to make changes to both the details and code of the Threat Defender Library content you have created which are in the Draft and Shared as Preview statuses.
Before you Start
You must have the necessary permissions to update TDL content. For assistance, contact your Collaborate administrator.
Steps
To update TDL content, follow these steps:
Click Threat Defender Library on the sidebar.
Hover over the TDL content from the list and click Edit. You can also directly click the TDL content title from the list to edit the content.
Modify the content details based on your preference. For more information about fields while updating content, see Create TDL Content.
Clone TDL Content
You can clone Threat Defender Library content to create a copy of existing content and modify content based on your preference.
Before you Start
You must have the necessary permissions to clone TDL content. For assistance, contact your Collaborate administrator.
Steps
To clone content in TDL, follow these steps:
Click Threat Defender Library on the sidebar.
Hover over the TDL content from the list, and click Clone.
Alternatively, you can click the content to view the content details. Click the vertical ellipses, and select Clone to clone the content.
The cloned content appears in the My Repo section. You can modify the content to either save it as a draft or share it as a preview. For more information, see Edit TDL Content.
Share TDL Content as a Preview
You can share content that you create as a preview to other members of your organization. This helps you validate content before submitting it to analysts for review.
Before you Start
You must have the necessary permissions to create TDL content. For assistance, contact your Collaborate administrator.
Steps
To share content for preview, follow these steps:
Click Threat Defender Library on the sidebar.
Select My Repo and select the content that you want to share as a preview. Alternatively, you can also share content that you are creating as a preview.
Click Share as Preview. The content is shared with other members of your organization as a preview in My Org Repo.
Submit for Review
You can submit TDL content created by you to analysts and other members of your organization (if peer review is enabled).
Before you Start
You must have the necessary permissions to create TDL content. For assistance, contact your Collaborate administrator.
Steps
To submit TDL content for review, follow these steps:
Follow the steps in Create TDL Content and create new content on the Threat Defender Library. You can also open a Draft content from the My Repo section and submit it for review.
When the content is ready for review you can submit it for review. Use the following information to submit TDL content for review:
Click Submit for Peer Review to submit the content with other members of your organization for peer review. Members can review and accept or decline content to provide a response to the reviewed content. The content creator can view the peer-reviewed content on the My Repo with Declined by Peer Member or Under Analyst Review status.
Click Submit for Analyst Review to submit the content to the Analyst Portal for analyst review. The content submitted to analyst review is published to the Shared Repo of Member Portal Threat Defender Library when approved by an analyst. To know more about the review process flow, see the Peer Review TDL Content.
TDL Content Categories
This document shows the list of content categories supported by TDL. You, as a member, can use these categories to create TDL content.
MITRE Engage is a knowledge base developed by MITRE. Engage provides information for a range of levels, including practitioner-friendly discussions of defense tactics, techniques, and procedures (TTP) and CISO-ready considerations of objectives and opportunities.
CAR analytics is a repository of analytical tools created by MITRE, primarily based on the MITRE ATT&CK adversary model. These analytics are designed to analyze various data domains (such as host, network, process, and external data) and are aimed at providing effective and well-explained analytics.
CAR analytics category is not supported when you create TDL content by selecting a category.
SIEM software collects log and event data generated by applications, devices, infrastructure, networks, and systems to analyze and provide complete visibility into an organization’s data. SIEMs also analyze data in real-time using SIEM rules and statistical correlations to give you actionable insights.
When you create TDL content by selecting a category, you can only create rules for Devo, General(Other) SIEM, and IBM Qradar SIEM.
Threat detection content identifies threats using data from various sources, such as log files, monitoring tools, error messages, intrusion detection systems, and firewalls. Analysts can perform analysis after detection to understand its exact nature and the scope of the threat.
playbooks are a well-defined set of actions that are organized as a workflow to respond to an incident or a threat. They are designed to perform a multitude of security automation and orchestration tasks that are part of the incident response process. You can use playbooks to automate various manual and repetitive tasks, as well as to orchestrate common scenarios including but not restricted to analyzing vulnerabilities, IOCs (Indicators of Compromise), searching for suspicious logs, and more.
The Response (Playbook) category is not supported when you create content by selecting a category.
Threat detection content identifies threats using data from various sources. Snort and Suricata are some of the detection methods used by security analysts. Snort is an open-source intrusion detection and intrusion prevention system (IDS/IPS) that monitors and analyzes network traffic in real-time to help identify and prevent potential security breaches. Suricata is a Network Security Monitoring (NSM) tool that can detect and block attacks against your network using rules.
Threat Detection (Snort/Suricata) category is not supported when you create content by selecting a category.
MITRE framework TTP analysis can help security teams detect and mitigate attacks by understanding the way threat actors operate. Tactics are types of activity that cyber criminals use to carry out an attack while techniques are general methods that attackers use to achieve their goals. A procedure is a specific series of steps that cybercriminals can use to carry out an attack.
Warning lists are lists of well-known indicators that can be associated with potential false positives, errors, or mistakes.
YARA rules are used to identify malware files and various indicators, including IP addresses, hashes, domains, and more by matching familiar patterns. YARA rules can identify distinctive traits like patterns and strings associated with malware or entire malware families.
Threat Detection (YARA Rules) category is not supported when you create content by selecting a category.
Important
This category is available in v3.8.5 onwards.
Zeek is an open-source network monitoring tool that detects threats through real-time network traffic analysis. It identifies suspicious activity and security breaches with deep protocol analysis and detailed session logs. Zeek’s customizable scripting language enables you to create specific rules for detecting network anomalies and potential threats.
Threat Detection (Zeek) category is not supported when you create content by selecting a category.
TDL Content Examples
This document shows validated examples of all the content types supported by TDL. As a member, you can use these examples to create valid TDL content in the supported file formats.
YARA rules are patterns or conditions written in the YARA language to identify and classify malware based on specific characteristics. They consist of strings, conditions, and optional actions, enabling the creation of flexible and customizable malware detection signatures. The following YARA rule is an example of successfully validated TDL content. This YARA rule is designed to detect the presence of the BlackHole Exploit Kit (EK) based on specific strings and conditions associated with the kit:
rule blackhole2_jar : EK
{
meta:
   author = "John Doe"
   date = "2016-06-27"
   description = "BlackHole Exploit Kit Detection"
   hash0 = "sjhbsvkiusbdosdbvskdvbsd"
   sample_filetype = "unknown"
   yaragenerator = "https://github.com/Xen0ph0n/YaraGenerator"
strings:
   $string0 = "k0/3;N"
   $string1 = "g:WlY0"
   $string2 = "(ww6Ou"
   $string3 = "SOUGX["
   $string4 = "7X2ANb"
   $string5 = "r8L<;zYH)"
   $string6 = "fbeatbea/fbeatbee.classPK"
   $string7 = "fbeatbea/fbeatbec.class"
   $string8 = "fbeatbea/fbeatbef.class"
   $string9 = "fbeatbea/fbeatbef.classPK"
   $string10 = "fbeatbea/fbeatbea.class"
   $string11 = "fbeatbea/fbeatbeb.classPK"
   $string12 = "nOJh-2"
   $string13 = "[af:Fr"
condition:
   13 of them
}
YAML is a human-readable data-serialization language and useful for managing data. YAML is used as a format to create detection rules in the security community and one such example is Sigma rules created in YAML format. Sigma makes it easy to perform content matching based on collected logs to create threat alerts. YAML files are also used to create MITRE Cyber Analytics Repository (CAR) files for detection. The following YAML rule is an example of successfully validated TDL content:
title: Antivirus Hacktool Detection
id: fa0c05b6-8ad3-468d-8231-c1cbccb64fba
description: Detects a highly relevant Antivirus alert that reports a hack tool or other attack tool
status: experimental
date: 2021/08/16
author: Florian Roth
references:
    - https://www.nextron-systems.com/2021/08/16/antivirus-event-analysis-cheat-sheet-v1-8-2/
logsource:
    product: antivirus
detection:
    selection:
        - Signature|startswith:
            - 'HTOOL'
            - 'HKTL'
            - 'SecurityTool'
            - 'ATK/'  # Sophos
        - Signature|contains:
            - 'Hacktool'
    condition: selection
fields:
    - FileName
    - User
falsepositives:
    - Unlikely
level: high
tags:
    - attack.execution
- attack.t1204A Splunk query is used to run a specific operation within the Splunk software. A Splunk query uses the software’s Search Processing Language to communicate with a database or source of data. This allows data users to perform analysis of their data by querying it. Splunk’s query language is mainly used for parsing log files and extracting reference information from machine-produced data. Splunk query files are saved in .spl format. The following Splunk query is an example of successfully validated TDL content:
index=main earliest=-7d sourcetype="WinEventLog:Microsoft-Windows-Sysmon/Operational" LogName=System EventCode=7009 Message="A timeout was reached*" | table host _time Message
Snort is an open-source intrusion detection and intrusion prevention system (IDS/IPS) that monitors and analyzes network traffic in real-time to help identify and prevent potential security breaches. It analyzes network activity and compares it to predefined Snort rules to identify unusual patterns or behaviors that might indicate an intrusion or attack attempt. Besides, Snort rules can be configured to actively block or prevent malicious traffic from getting to its target, making it an effective tool for intrusion prevention. Snort rule files are saved in .rules format. The following Snort rule is an example of successfully validated TDL content:
# alert tcp $EXTERNAL_NET any -> $TELNET_SERVERS 23 (msg:"PROTOCOL-TELNET RuggedCom default backdoor login attempt"; flow:to_server,established; flowbits:isset,telnet.ruggedcom; content:"factory"; metadata:policy security-ips drop, service telnet; reference:cve,2012-1803; reference:url,www.securityfocus.com/archive/1/522467; classtype:attempted-admin; sid:21938; rev:4;)
# alert tcp $TELNET_SERVERS 23 -> $EXTERNAL_NET any (msg:"PROTOCOL-TELNET login failed"; flow:to_client,established; content:"Login failed"; nocase; metadata:ruleset community, service telnet; classtype:bad-unknown; sid:492; rev:15;)
# alert tcp $TELNET_SERVERS 23 -> $EXTERNAL_NET any (msg:"PROTOCOL-TELNET login incorrect"; flow:to_client,established; content:"Login incorrect"; metadata:ruleset community, service telnet; classtype:bad-unknown; sid:718; rev:16;)
Suricata is a Network Security Monitoring (NSM) tool that can detect and block attacks against your network. Suricata rules are pluggable intelligence components that are used to detect known threats in network traffic. Suricata rules are also used for sharing and matching threat intelligence against network traffic. Suricata rules are saved in .rules format. The following Suricata rule is an example of successfully validated TDL content:
alert ip any any -> any any (msg:"SURICATA Applayer Mismatch protocol both directions"; flow:established; app-layer-event:applayer_mismatch_protocol_both_directions; flowint:applayer.anomaly.count,+,1; classtype:protocol-command-decode; sid:2260000; rev:1;)
alert ip any any -> any any (msg:"SURICATA Applayer Wrong direction first Data"; flow:established; app-layer-event:applayer_wrong_direction_first_data; flowint:applayer.anomaly.count,+,1; classtype:protocol-command-decode; sid:2260001; rev:1;)
alert ip any any -> any any (msg:"SURICATA Applayer Detect protocol only one direction"; flow:established; app-layer-event:applayer_detect_protocol_only_one_direction; flowint:applayer.anomaly.count,+,1; classtype:protocol-command-decode; sid:2260002; rev:1;)
alert ip any any -> any any (msg:"SURICATA Applayer Protocol detection skipped"; flow:established; app-layer-event:applayer_proto_detection_skipped; flowint:applayer.anomaly.count,+,1; classtype:protocol-command-decode; sid:2260003; rev:1;)
# alert if STARTTLS was not followed by actual SSL/TLS
alert tcp any any -> any any (msg:"SURICATA Applayer No TLS after STARTTLS"; flow:established; app-layer-event:applayer_no_tls_after_starttls; flowint:applayer.anomaly.count,+,1; classtype:protocol-command-decode; sid:2260004; rev:2;)
# unexpected protocol in protocol upgrade
alert tcp any any -> any any (msg:"SURICATA Applayer Unexpected protocol"; flow:established; app-layer-event:applayer_unexpected_protocol; flowint:applayer.anomaly.count,+,1; classtype:protocol-command-decode; sid:2260005; rev:1;)

#next sid is 2260006
playbooks are a well-defined set of actions that are organized as a workflow to respond to an incident or a threat. You can use playbooks to automate various manual and repetitive tasks, as well as to orchestrate common scenarios including but not restricted to analyzing vulnerabilities, IOCs (Indicators of Compromise), searching for suspicious logs, and more. The following JSON is an example playbook from the application:
{
        "title": "Connect the Dots :: Incident to Action",
        "start_node": "start",
        "nodes": {
        "1": {
        "type": "REGULAR",
        "internal_id": "1",
        "title": "incident to action",
        "description": null,
        "actions": [
        {
        "action": "update_incident",
        "parameter_data_source": {
        "status": "open",
        "loop_keys": [],
        "unique_id": "${event::data::inc_uid}",
        "extra_fields": {
        "actions": "$LIST[${event::data::action_uids}]",
        "__loop_keys__": []
        }
        },
        "action_type": "PREDEFINED",
        "code": null,
        "app_instances": [],
        "playbook": null,
        "playbook_data": null,
        "action_data": {
        "action_identifier": "update_incident",
        "app": "cftr_v2",
        "app_slug": "cftr_v2_2_4_1",
        "app_version": "2.4.1",
        "app_title": "Cyware Fusion and Threat Response (CFTR)",
        "action_title": "Update Incident details",
        "is_system": true
        },
        "output_params": {},
        "save_customized_result": false,
        "run_async": false,
        "action_run_attempt": 1,
        "action_run_buffer_time": 1,
        "save_result": true,
        "storage_manager_reference": []
        }
        ],
        "conditions": [],
        "extra_params": {
        "position": {
        "x": 400,
        "y": 200
        }
        },
        "io_params_format": {},
        "stop_on_error": true,
        "memory_params": {},
        "sub_type": "PREDEFINED",
        "condition_type": null,
        "io_params_email_details": null,
        "enable_io_param_email_details": false,
        "enable_app_notification": false,
        "storage_manager_reference": []
        },
        "start": {
        "type": "START",
        "internal_id": "start",
        "title": "Start",
        "description": null,
        "actions": [],
        "conditions": [],
        "extra_params": {
        "position": {
        "x": 400,
        "y": 50
        }
        },
        "io_params_format": {},
        "stop_on_error": true,
        "memory_params": {},
        "sub_type": "start",
        "condition_type": null,
        "io_params_email_details": null,
        "enable_io_param_email_details": false,
        "enable_app_notification": false,
        "storage_manager_reference": []
        }
        },
        "edges": [
        {
        "source_node": "start",
        "destination_node": "1",
        "label": "DEFAULT_LABEL",
        "extra_params": {}
        }
        ],
        "type": "UI",
        "labels": [],
        "tags": [],
        "extra_params": {
        "current_node": "1"
        },
        "status": "ACTIVE",
        "script_content": "",
        "cron_expression": null,
        "output_params": {},
        "is_runnable": false,
        "description": "Incident description",
        "auto_terminate": false,
        "auto_terminate_interval": null,
        "categories": [
        "Incident Enrichment"
        ],
        "schedule_info": {
        "details": {
        "run_count": 0
        },
        "is_scheduled": false
        },
        "storage_manager_reference": []
        }
Zeek is a network monitoring tool you can use to analyze network traffic in real time for threat detection. It captures detailed information about network sessions, protocols, and traffic flows, helping you identify potential threats. You can write custom detection logic using Zeek's scripting language to create your own rules.
The following Zeek rule is an example of detecting UDP packets with suspicious payloads and additional conditions:
signature mixed_conditions_actions {
    payload /suspicious-data/
    payload-size <= 1500
    ip-proto == udp
    event data_event "Suspicious UDP payload detected"
    enable "ftp"
}
The following Zeek rule is an example of detecting SSL traffic based on specific source, destination IP, and port conditions:
signature complex_header {
    src-ip == 192.168.1.1
    dst-ip != 10.0.0.1
    dst-port == 443
    event ssl_traffic_event "SSL traffic detected from a specific source"
}
The following Zeek rule is an example to monitor the states of UDP ports and trigger events for open ports:
signature udp_state_check {
    udp-state open
    event udp_open_event "UDP port open"
}
RSS Feeds
RSS feeds are open-source feeds from trusted sources, such as government agencies, security blogs, organizations within the cybersecurity industry, and similar. Members can view data from different subscribed RSS feeds available to them. Instead of navigating to many RSS feed source URLs on the internet, members can view them all in one consolidated place in the Member Portal.
Members can subscribe to RSS feeds that have been enabled by an administrator from the Analyst Portal. Once you follow a feed, you can see, at a glance, if a feed is new, unread, read, bookmarked, or archived. Members can also initiate alert-based discussions, as well as create and assign recommended actions to other users.
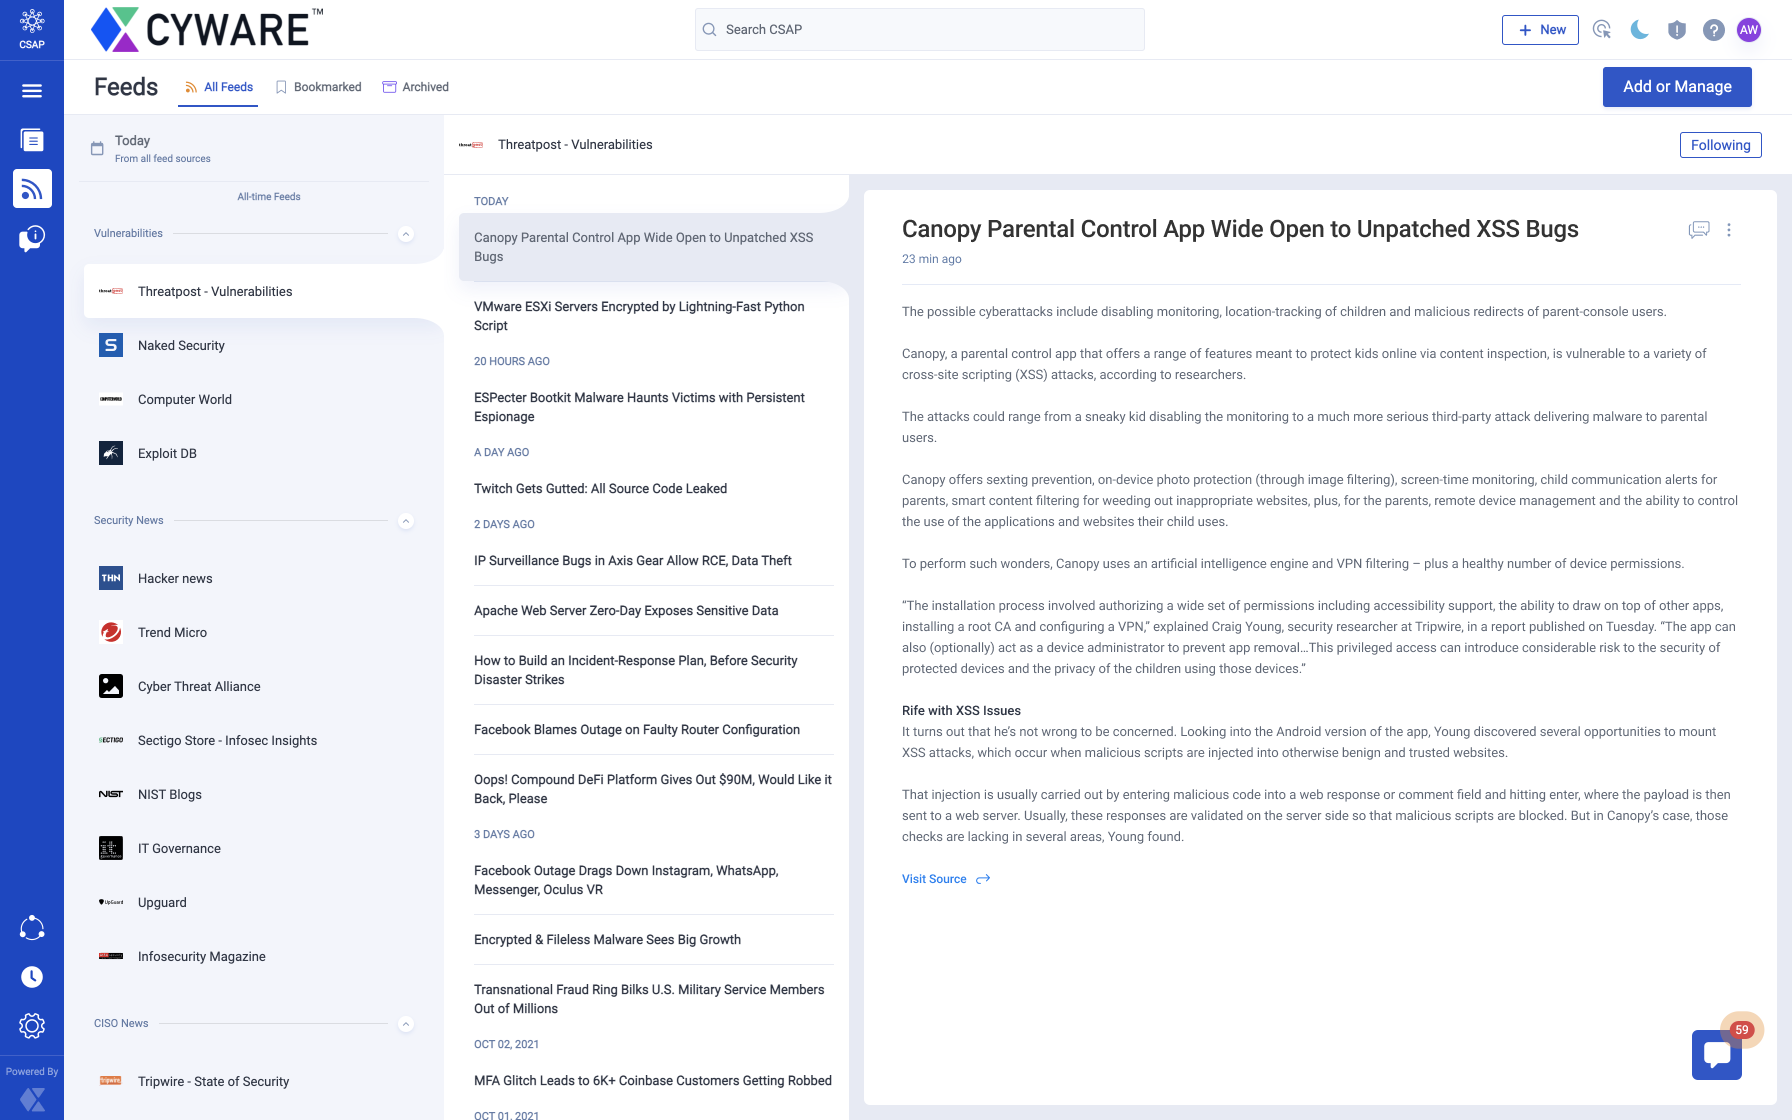
From the Main Menu, navigate to Feeds to view RSS feeds.
It contains the following sections:
All Feeds: Displays all feeds that you follow.
To bookmark an article, click the vertical ellipsis in the upper-right corner and click Bookmark.
To archive an article, click the vertical ellipsis in the upper-right corner and click Archive.
Bookmarked: Displays all articles that you have marked as important.
Archived: Displays all articles that you have archived. You can always unarchive an article in this section.
Add RSS Feeds
RSS feeds are open-source feeds from trusted sources, such as government agencies, security blogs, organizations within the cybersecurity industry, and more.
Note
To request an RSS feed, contact your administrator.
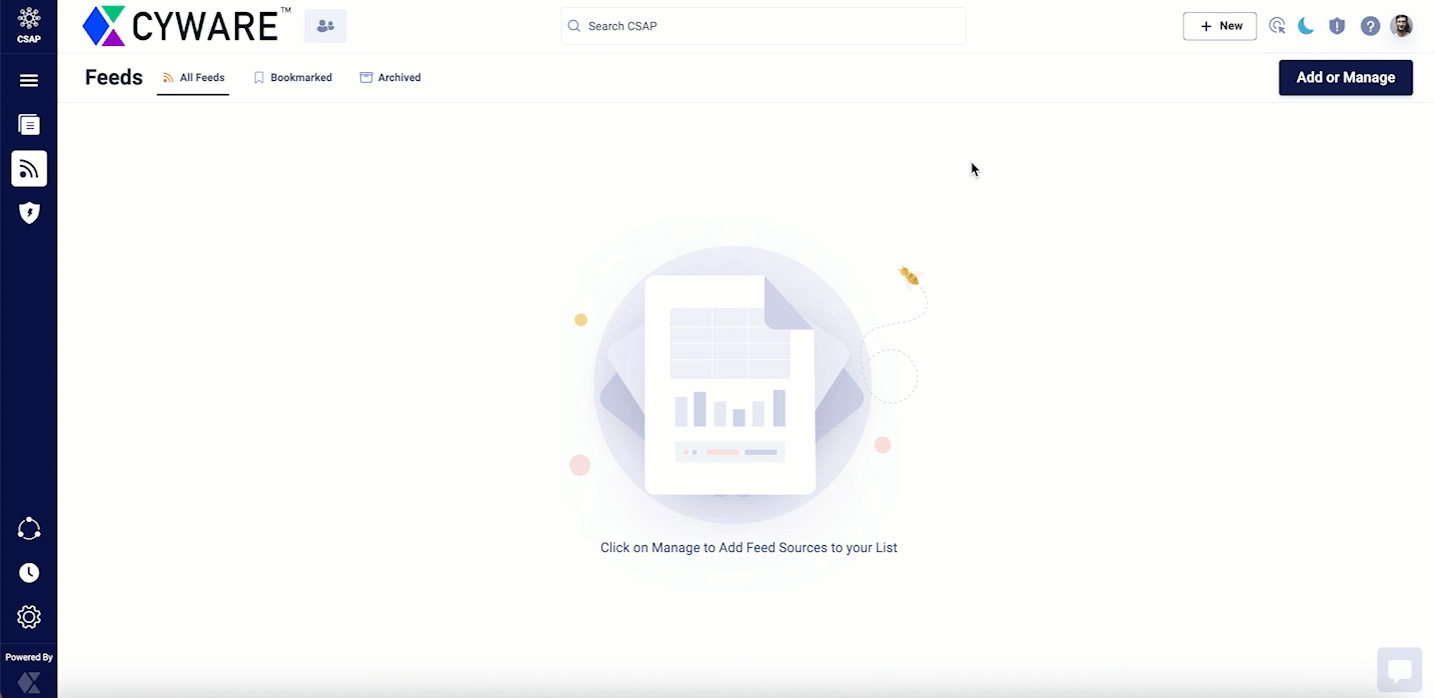
The following image shows how to add an RSS feed source:
 |
Steps
To add and manage RSS feeds, follow these steps:
From Feeds, click Add or Manage.
Search for the feed you want to manage by typing your query into the Search bar.
Alternatively, you can manually search for RSS feeds by navigating the list of available RSS feeds.
For each RSS feed you want to follow, under Actions, click Follow. If you already follow an RSS feed, click Following to unfollow a particular feed.
Manage RSS Feeds
From the All Feeds section, navigate to a feed and click a specific article. You can then perform the following actions:
To initiate or join a topic-based discussion with a group, click Messenger in the upper-right corner, and select the relevant recipient group.
In the top-right corner of the article, click the vertical ellipsis, and use the following options:
Create Action: Create an action associated with the article and assign it to other members. For more information, see Manage Actions.
Archive: Archive the feed article. You can then view this article in the Archived section.
Bookmark: Mark a feed as important. You can then view this article in Bookmarked section.
Export: Export and save the article as a PDF, or print it for offline analysis. You can also specify the number of pages and layout for the article you want to export. All fields associated with the article are available in the exported output.
Share Opinions Using Surveys
The Member Portal enables you to answer surveys published by a survey analyst from the Analyst Portal. Additionally, you can also submit requests for surveys on specific topics to the survey analyst. These surveys can be published and distributed to all the members after review.
Request a Survey
Members can request a survey from analysts to include information on threats, vulnerabilities, malware, and more.
Before you start
You must have the View and Submit a Survey permission to access the Surveys.
Steps
To request a survey, do the following:
Navigate to the Main Menu and select Request Survey.
Click Create.
Enter a Survey Title.
Select the question type: Single Select, Multi Select, or Text Box.
Enter the survey question.
Enter choice 1, choice 2, and so on to extend the limit of choices.
For single-select or multi-select questions, you must include a minimum of 2 choices. You can have a maximum of 8 choices.
For Textbox, you can type your question, and the respondent can type their answer in 1000 characters.
Click Add Option to include choices and click Save.
Click Add Question to include a new question in the survey.
To make changes to the survey information click Previous.
Click Save to save the changes.
To submit the survey to the analyst, click Submit.
To review and make changes to the survey, click Save as Draft.
View Requested Surveys
Surveys requested by members assist in evaluating the information about threats and cyber events. For example, you can create surveys that assess the resolution of incidents, problems, or service requests. Use the following information to know more about surveys:
My Submissions: Displays the list of surveys you have requested. You can filter surveys based on Title, Submitted on, Number of Questions, and Status.
Survey List: Displays the list of survey requests submitted by members of the organization. You can filter and view surveys based on ID, Title, Status, TLP, Submitted on, Number of Questions, and Response.
View Survey Trends: Survey trends equip stakeholders with a graphical representation to improve situational awareness and resilience.
Before you start
You must have the View and Submit a Survey permission to access Surveys.
Steps
To view survey trends, do the following:
Navigate to the Main Menu and select Surveys.
Click My Submissions or Survey List.
Enter a Survey Title in Search or use Filter.
Click on the survey to view the Questionnaire.
Click Question View to view the overall response recorded for each answer.
Click Chart View to view responses in numerical data and compare KPIs.
Manage Surveys
Click Survey List to view the list of surveys published by your analyst. The list is categorized as New, Skipped, and Archived for ease of accessibility.
New: Displays new surveys.
Skipped: Displays skipped surveys. These surveys can be answered before they expire.
Archived: Saves and displays surveys with a response.
CSAP surveys can be categorized into Open and Closed surveys based on the active time and time of expiry.
Open Survey: The surveys that are open for answering in the CSAP Member portal.
Closed Surveys: The surveys that are expired and cannot be accessed for answering in the CSAP Member portal.
Apply Filters to Surveys
Filters provide a way to display the exact analytics you look for by drilling down a list using a value.
Steps
To create and apply filters in CSAP Member Portal, do the following:
Select Filters. Apply one or more below-mentioned filters to refine your search result.
Status: Select whether the survey is Open or Closed.
TLP: Select the appropriate color Amber, Green, Red, or White.
Responded: Select whether the survey is Responded or Not Responded.
Published Date: Select the time interval between which the survey was sent or enter a specific date by including the start and end time.
To save the filter for future use click Save this view. The saved filter can be viewed under Saved presets.
Click Apply and view the survey details.
View Survey Details
You can view the survey details to have a birds-eye view of the questionnaire you are assigned to.
Navigate to Surveys from the Dashboard.
View the following details about the surveys:
Survey ID - Unique survey ID.
Title - Title for the survey.
Survey Expiry - Expiration time and date of the survey.
Status - Open or Closed.
TLP - Priority of the sensitive information.
Number of Questions - Number of questions available in the survey.
Responded - Denotes whether the survey is answered or not.
Actions - Custom link to the survey.
Filters - Set of customized filters to refine search results.
Walkthrough - Virtual tour of the surveys module.
Supported Functionalities for Surveys
A survey represents a questionnaire assigned to members. You can visualize the survey data to evaluate the responses and perform the following actions:
Navigate to the Main Menu and select Surveys.
Click Refresh to refresh the list for the latest Surveys.
Click Filter to show or hide the filter and search tool. Enter search keywords on the filter and search tool to perform filter, search and sort actions.
Click Export CSV to export survey details to CSAP in .CSV format. The report will be compiled in the background and sent through email. The background process time depends on the volume of Survey details exported.
Click Create to create a survey. Analysts who are responsible for creating, reviewing, and publishing surveys to members can use this feature.
On the survey listing page, you can do the following:
Edit: Modify the contents of the survey.
View: View the details of a survey.
Expire: Expire a survey.
Ellipsis: Select to send email notifications, reopen surveys, and export responses.
Manage Actions
Actions are tasks assigned to you, as a member, based on threat insights shared in the alerts or as a course of normal security measures. Actions have a due date, Open or Closed status, and need to be tracked to completion.
Recommended actions are suggestions or recommendations that you can suggest to other members. Recommended actions do not have a status or a due date. Recommended actions can be converted to actions if you want to track them to completion.
You can create actions or recommended actions in the following ways:
Analysts can create actions and assign them to you while creating alerts from the Analyst Portal. For more information, see Recommend Actions to Members.
You can create actions either independently or from alerts received and assign them to yourself or other members of the Member Portal. For more information, see Create a New Action.
You can also create recommendations or suggestions. See Create Recommended Actions.
Create a New Action
You can create actions independently or create actions from an alert.
Steps
To create a new action, do the following:
Click Actions, in the upper-right corner. Alternatively, from Alerts, select an alert and click Create, and select Create Action.
Click Create.
Enter a title and description for your action.
Enter a due date to complete the action.
From Assign Member, assign the action to a member.
Click Create to create the action.
View Actions
View and manage the details of all the tasks that you created. Use the following information to know more about managing actions:
From the upper-right corner, click Actions.
Created by Me: Get a centralized view of tasks that you created.
Assigned to Me: Get a centralized view of tasks assigned to you.
All: Get a centralized view of all tasks.
Open: Get a birds-eye view of all tasks you still need to perform.
Closed: Get a birds-eye view of all actions you have performed and closed.
Select an action and you can view details associated with the action such as the status of the action, comments on the action, commenter name, action ID, due date, the user who created the action, created date, and assignees.
You can choose to add any comments for an action.
To close an Open action, click Status, enter a comment, and click Submit.
To reopen a Closed action, click Status, enter a comment, and click Submit.
Create Recommended Actions
Recommended Actions are associated with alerts, and are suggestions or recommendations that members can make to other members. To create a recommended action:
Steps
Navigate to Alerts, and select the alert for which you want to create the action.
Click Create Action, and select Create Recommended Action. A recommended action does not have a due date to close the action.
Enter a title and write a complete description of your recommendation.
Select one of the following recipient options:
Members in my Org: Choose to share with all members in your organization.
One or more Groups: Select a recipient group to share your information. Members can share recommended actions with the recipient groups that they are part of. Member administrators in the CSAP Member Portal can share recommended actions with all the members of their organization.
One or more Members: Select one or more individual members to share your recommendations. Members can share recommended actions with the recipient groups that they are part of. Member administrators in the CSAP Member Portal can share recommended actions with all the members of their organization.
View Recommended Actions
View and manage the details of recommended actions that you created.
Select a recommended action and you can view details associated with the recommended action such as action ID, alert ID, due date, the user who created the action, created date, and assignees.
Click Convert to Action to convert this recommendation to an Action.
Messenger
Notice
This feature is available only for Cyware cloud-based deployments.
The Member Portal contains a secure and dedicated messenger that allows you to collaborate with other members, create groups for discussion, and start discussions based on topics. You can also leave your suggestions and messages, as well as view other member user responses from the discussion groups.
Use the Messenger feature in the lower-right corner of the Member Portal to initiate the following discussion types:
Alert-based discussions
Group discussions
Direct discussions
Topic-based discussions
Note
You can view these discussion types based on the configuration in the Analyst Portal.
View Alert-Based Discussions
View discussions based on alerts received in the Member Portal. The alerts that are tagged with the recipient groups that you are part of are visible in Alerts in Messenger. Select Alerts to view discussions based on alerts.
Select All to view all alert-based discussions.
Select Current to view the most recent discussions tagged as part of alerts.
Create Topic-Based Discussions
You can create topic-based discussions to start conversations on a specific topic with a custom group or a recipient group. If group-based discussions are enabled for you, you can create topic-based discussions with a custom group.
Steps
Go to Messenger and click +, and select Topic.
Enter a Topic Name and a Description.
Select a Group. All the recipient groups that you are part of are listed here. Members can chat on a specific topic with the participants of the selected group.
Select a TLP and click Create.
Note
Users who are part of the selected group will receive an email notification.
Create Group Discussions
Create groups with other member users of your organization, and initiate discussions with these custom groups. You can create custom groups if group-based discussions are enabled for you in the Analyst Portal.
Steps
Go to Messenger and click +, and select Group.
Select Group.
Enter a name for the group and select members. You can select from all the members present in your organization.
Click Create.
Note
These groups are available while creating or editing topic-based discussions.
Create Direct Discussions
Initiate direct discussions with any member user in your organization.
Steps
Go to Messenger and click +, and select Direct.
Click New Conversation.
Search and select a user in the Member Portal.
Click Start Conversation and start a direct discussion.
Include Indicators in Messages
You can include indicators in a message thread. These are identified from within the message and are highlighted as observables.
To tag indicators, type
/iocin the message bar, followed by a valid entry, such as an IP address, email, URL, hash, and so on.Press Enter or click Send. You can view these values in Observables.
To view observables, in a topic thread, click Show Observables.
In Observables, you can view and search for the IOCs entered in the topic thread.
To extract and download the indicators from a conversation, click CSV. Members can directly extract indicators from a conversation, in a list view, and export them, in a .csv file format, for offline analysis. Download the .csv file to view the indicator, type, and date of capture.
Choose Availability Status
You can change your availability status in the Messenger from the upper-right corner. You can choose between Online, Away, Do Not Disturb, and Offline.
Mention Users in a Conversation
In Messenger, you can mention other users in a conversation. You can directly notify a member or analyst, with the specific messages to review. To mention a user in a conversation, type @, followed by the name of the member user.
Configure Messenger Settings
Configure layout and notification preferences for the messenger to personalize your chat experience.
Steps
To configure Messenger Settings, do the following:
Sign in to the Member Portal and click Messenger in the lower-right corner.
In the upper-right corner, click Maximize to expand Messenger, and click Settings.
Click Layout Style to personalize your chat experience. Choose your messenger layout, and click Switch Layout.
Click Notifications to configure messenger notifications.
Enable Mobile App (Push-notification) to configure push notifications for Cyware Enterprise mobile app. Select the module from which you like to receive notifications.
Enable Email Notifications to configure email notifications for Member Portal. Select the module from which you like to receive notifications.
Select the Email Notify Duration to send an email once in 15 minutes, one hour, two hours, four hours, or eight hours.
View Threat Levels
Analysts can configure and use threat levels to display any important information such as current malicious cyber activity, potential or actual damage caused by the threats, and so on from the Analyst Portal.
Threat levels can be used to convey:
Real-time cyber activity status.
Likely damage that can occur due to a threat
Targets of a threat
Any preventive measures
Members can view this information in the Member Portal.
Before you start
Threat Levels must be enabled for members from the Analyst Portal from Settings > Alert Settings > Threat Levels. The toggle for Enable in Member Portal must be turned on. See Threat Levels.
Steps
To view Threat Levels, navigate to the upper-right corner of the Member Portal and click Threat Levels, next to the Dark Mode. You can view the Threat levels that are configured for your organization.
Intel Lake
Notice
This feature is available in v3.7.1.0 onwards
The Intel Lake is a collection of threat intel such as indicators, vulnerabilities, malware, and other threat intel. To view the Intel Lake in the Member Portal, the feature has to be enabled in the Analyst Portal. For more information, contact your administrator.
What are the use cases of Intel Lake?
A consolidated view of the threat intel in helps members understand the threat intel type, associated confidence Score, TLP, and more.
Members can click a specific threat intel to view the basic and any additional details. For more information, see View Basic Details of Threat Intel Objects.
A visual representation of the threat intel enables members to view the associated threat intel objects. For more information, see View Relations of Threat Intel Objects.
To view Intel Lake in the Member Portal, navigate to Intel Lake in the sidebar. The Intel Lake listing page displays a maximum of 50,000 threat intel objects. Additionally, you can search for threat intel using the search and filter option.
Note
You can view Intel Lake dashboards by navigating to Dashboards > Intel Lake. For more information, see View Member Dashboards.
The Intel Lake listing page provides the following information about IOCs:
Displayed Column | Description |
|---|---|
Value | Displays the actual value of the threat intel. For example, BlackGuard and Killnet. |
Type | Displays the type of threat intel. The different types are Indicator, Malware, Threat Actor, Vulnerability, Attack Pattern, Campaign, Course of Action, Identity, Infrastructure, Intrusion Set, Location, Malware Analysis, Observed Data, Tool, Report, Custom Object, Observable, Incident, Note and Opinion. |
Confidence Score | Displays the confidence score for the threat intel. The confidence score is a value between 0 and 100 that is automatically assigned to a threat intel object by the scoring engine. A confidence score of 0 suggests that it is safe. An increasing score up to 100 suggests that the IOC is highly malicious. Confidence scores are only displayed for intel-type indicators. |
TLP | Displays the Traffic Light Protocol value of the threat intel. For more information, see Traffic Light Protocol (TLP). |
Created Date | Displays the date when the threat intel is created. For example, Apr 26, 2023, 07:10 PM. |
Modified Date | Displays the date when the threat intel details are modified. |
IOC type | Displays the type of IOC. IOC type is displayed for intel objects which are indicators. For example, Domain, URL, IPv4 Address and SHA-1. |
View Basic Details of Threat Intel Objects
Click a threat data object to view the following details:
Basic Details: View basic information about the threat intel. The fields displayed in Basic Details are connected to the type of threat intel. For example, if the threat intel is an Indicator, the fields displayed are Confidence Score, Description, IOC Type, Value, TLP, Created, Modified, Country, Valid Until, Revoked, and Tags. Similarly, if the threat intel is Malware, a field called Malware Family is displayed along with other fields.
Note
If the threat intel has a description, you can fang and defang IOCs in the description using the Fang-Defang toggle.
Additional Details: View custom attributes for each threat intel. A custom attribute is additional information that provides context about the threat intel.
Relations: Displays a visual representation of the threat intel and its relation or connection to other threat intel. For more information, see View Relations of Threat Intel Objects.
View Relations of Threat Intel Objects
The Relations section provides a visual representation of the threat intel and its associated relations to other threat intel objects. This visualization enables members to get a contextual understanding of the threat intel for threat analysis. This in turn assists in understanding the potential impact on an organization, and proactively mitigating threats.
In Relations, you can view threat intel relations in the following ways:
Visualizer: View a graphical representation of the threat intel object and other related objects. To view the relation in a different visual layout, select different layouts such as Sequential, Lens, Hierarchy, and others. By default, the layout is Organic.
Hover or click the related threat intel object to view more details. Click Detailed View to open the selected threat object in a new tab. You can now view all available details of the object.
Table: View the relation between different threat intel objects in a table format.
Search and Filter Threat Intel Objects
You can filter threat objects using the CQL or basic search. Switch between the two options to search and filter threat object data according to your preference.
CQL: Use Cyware Query Language (CQL) search to perform advanced searches that include a combination of parameters and operators.
CQL grammar is a combination of parameters (Object Type, IOC Type, Confidence Score, and more), conditions (AND, IN, MATCHES, OR), and operators (=, >,<, >=, <=, !=, and more). For more information about CQL parameters supported in Intel Lake, see CQL Parameters.
Note
You can copy and share CQL queries with other members, enhancing collaboration.
BASIC: Switch from CQL to basic search to filter by the type, IOC type, TLP, created date, and modified date. For example, you can set the filter for Type as Indicator, IOC type as Domain, and TLP as RED. The search results display all domains with the TLP: RED.
To search for threat object data, type in the Type/ Select Filter and click Search. The search results are based on the value of the threat intel object.
To save a filtered search, click Save Search, and enter a name. This enables you to collate frequently searched threat intel and save time.
Your saved searches are available in the Saved Search section on the left. You can choose to remove the saved searches or rename them according to your preferences. Additionally, you can modify a saved search by changing the filters of the search. After changing filters, you can either create a new saved search or choose to update the existing saved search.
The following CQL parameters are supported in Intel Lake:
Parameter | Description | Example Query |
Type | STIX type of the threat data object which includes Indicator, Malware, Threat Actor, Vulnerability, Attack Pattern, Campaign, Course of Action, Identity, Infrastructure, Intrusion Set, Location, Malware Analysis, Observed Data, Opinion, Tool, Report, Custom Object, Observable, Incident, and Note. | Use 'Object Type' = "Indicator"to view all indicators. |
IOC Type | The different types of indicators of compromise (IOC). This includes Artifact, Autonomous System, Directory, Domain, Email address, Email message, Ipv4 address, Ipv6 address, Mac address, Mutex, Network traffic, Process, Software, URL, User account, Windows registry key, X509 certificate, MD5, SHA1, SHA224, SHA256, SHA384, SHA512, and SSDEEP. | Use 'Object Type' = "indicator" AND 'IOC Type' = "ipv4 addr" to view indicators that IPv4 addresses. |
TLP | The set of designations that ensure sensitive information is correctly shared with the appropriate recipients. The available TLP values are Red, Amber, Green, White, and None. | Use 'Object Type' = "Malware" AND 'TLP' = "RED" to view malware classified as RED TLP. |
Confidence Score | The numerical assessment of the reliability of the threat data object. | Use 'Object Type' = "Indicator" AND 'Confidence Score' RANGE (10,90) to view the indicators that have confidence scores in the range of 10 and 90. |
Source Created | The date and time when the threat data object was reported by the source. | Use 'Object Type' = "indicator" AND 'Source Created' RANGE ("July 31, 2023, 12:00 AM", "August 15, 2023, 11:59 AM") to view indicators that were reported by a source on a given date range. |
Source Modified | The date and time when the threat data object was modified by the source. | Use 'Object Type' = "indicator" AND 'Source Modified' RANGE ("July 31, 2023, 12:00 AM", "August 15, 2023, 11:59 AM") to view indicators that were modified by a source on a given date range. |
System Created Date | The date and time of the threat data object creation. | Use 'Object Type' = "Malware" AND 'Created On' = "date" to view indicators created in Intel Lake on a particular date. |
System Modified Date | The date and time of the threat data object modification. | Use 'Object Type' = "Malware" AND 'Modified On' = "date" to view indicators modified in Intel Lake on a particular date. |
Valid From | The date and time from when the object type is valid. | Use 'Object Type' = "Indicator" AND 'Valid From' = "Date" to view indicators that are valid from a given date. |
Valid Until | The date and time until which the object type is valid. | Use 'Object Type' = "Indicator" AND 'Valid Until' = "Date" to view indicators that are valid until a given date. |
Tags | The text labels that are associated with the threat intel object. | Use 'Object Type' = "Vulnerability" AND 'tag' = "CVSS critical" to view vulnerabilities categorized as CVSS critical. |
Country | Countries associated with the threat intel object. | Use 'Object Type' = "Indicator" AND 'IOC Type' = "URL" AND 'Country' = "India" to view URLs from India. |
First Seen | The date and time when the threat object was first seen. | Use 'Object Type' = "Indicator" AND 'First Seen' = "Date" to view indicators that are first seen on the specified date. |
Last Seen | The date and time when the threat object was last seen. | Use 'Object Type' = "Indicator" AND 'Last Seen' = "Date" to view indicators that are last seen on the specified date. |
Revoked | Defines if the indicator is revoked. | Use Object Type' = "Indicator" AND 'Revoked' = "Yes" to view indicators marked as revoked. |
Value | The result data set includes numeric or text values for selected parameters. | Use 'Object Type' = "Indicator" AND 'Value' = "111.11.112.11" to see details of the indicator 111.11.112.11. |
Relation Created Date | The date and time of the relationship when it was created. | Use 'Object Type' = "Indicator" AND 'Relation Created Date' = 'Timestamp' to search for indicators with relations created on the specified timestamp. |
Relation Modified Date | The date and time of the relationship when it was modified. | Use 'Object Type' = "Indicator" AND 'Relation Modified Date' = 'Timestamp' to search for indicators with relations modified on the set date |
Relation Type | Defines the STIX relationship types. | Use 'Object Type' = "indicator" AND 'Relationship Type' = "targets" AND 'Related Object' = "malware" to view indicators that are related to a malware object by a particular relationship type. |
Related Object Property | Select a property of the related object to search for the relevant threat data objects. You can choose from object type, source, IOC type, source type, source collections, and more. | Use 'Object Type' = "Indicator" AND 'Related Object' = "Malware" AND 'Related Object Property: Source' = "Import" to view indicators that are related to a malware object received into the platform by importing intel. |
Related Object | Select the related object for the primary object. This allows you to focus on specific associations and refine your search. When you select a related object in a CQL query, all parameters defined after the related object are applied to the related object. | Use 'Object Type' = "Threat Actor" AND 'Relation Type' = "uses" AND 'Relation Object' = "Malware" to view threat actors that use a specific malware. |
Has Relations | Filter objects based on their relations with other objects. | Use 'Object Type' = "indicator" AND 'Has Relations' = "Yes" to view indicators that have relationships defined with other objects. |
Related Object Value | Enter the value of the related object to filter the relevant threat data objects. This parameter is useful when you want to filter objects related to an object with a specific value. You must provide a related object to use the related object value. | Use 'Object Type' = "Vulnerability" AND 'Related Object Type' = "Course of Action" AND 'Related Object Value' CONTAINS " google:chrome" to view vulnerabilities that are fixed by a specified browser. |
Custom Attribute | Threat data objects that have custom attributes. | Use 'Object Type' = "Vulnerability" AND 'Custom Attribute' = "zero_day" to view vulnerabilities that have the zero-day custom attribute. |
Custom Attribute Type | Enter the type of custom attribute to search for threat data objects that have the same custom attribute type. You must provide a custom attribute value to search for a custom attribute type. | Use 'Object Type' = "Vulnerability" AND 'Custom Attribute' = "cvss_v3_temporal_score" AND 'Custom Attribute type' = "Float" AND 'Custom Attribute Value' > "5" to view vulnerabilities where the CVSS V3 Temporal Score is greater than 5. |
Custom Attribute Value | Enter the specific custom attribute value to search for threat data objects that have custom attributes with the mentioned value. | Use 'Object Type' = "Vulnerability" AND Custom Attribute' = "zero_day" AND 'Custom Attribute Value' = "true" to view vulnerabilities that have the zero-day custom attribute and it is set to true. |
While creating saved searches, you can schedule email reports for the saved searches. This helps you stay notified if new entries are added to your saved searches over a period of time. Saved searches with a calendar icon signify that email reports are scheduled for it.
Before you Start
The email server must be enabled for you. For more information, contact your administrator.
Steps
Select or type your query and click Save Search.
Enter the name of the report. To schedule an email report for the saved search, select the Schedule Report checkbox and click Save & Create Schedule. Use the following information while scheduling reports for saved searches:
Title: The title that you had previously entered for the saved search is automatically populated. You can retain this title or choose to rename the title. This title is displayed as the subject of the email report.
Start Date and Time: Specify the date and time from which the email report is generated. The default date and time is set to the next day.
Frequency: Set the report frequency for the specified duration. You can choose between Once, Hourly, Daily, Weekly, and Monthly. Based on your selection, you can select additional options for the report frequency. The default frequency is set to Once.
Duration of Data: Set the duration for which the report is generated.
Applies on: Select if the scheduled report applies on the system-created date of the indicators or the system-modified date.
Report Format: You can choose to receive the email report in CSV and XLS formats. The default report format is CSV.
Email Recipients: Select the email recipients for the scheduled report.
CSAP Users: Select the recipients from the dropdown. You can also choose to add recipients in CC and BCC.
Non-CSAP Users: To share the report with individuals outside , enter up to five email addresses using a comma as a separator.
To schedule the email report, click Schedule.
After you have scheduled a report for a saved search, you can update, rename, and delete it according to your preference by navigating to Saved Search and clicking the vertical ellipsis.
Events
Participate and submit requests for events such as summits, expert webinar series, meetings, and more. Analysts create event alerts and these events appear in your event calendar in the Member Portal. You can also submit requests to analysts to schedule events based on your preference.
View Events
As a member, you can view all the events scheduled for you, in the events calendar. In the Member Portal, click Events and use the following information:
Click any event in the calendar to view more details. You can view the start and end date of the event, along with the location (URL) of the event. The start and end time displayed here is based on your browser time. In About Event, you can view more information about the event. Respond to events by clicking Attend, Maybe, or Not Attending. Analysts can view your responses to events in the Analyst Portal.
Click Download Events to download an ICS file of all event-related information based on the date range specified by you. You can use this file to import events to other calendar applications of your choice.
To view the history of all events, as well as events submitted by you, click the vertical ellipsis, and click Events History.
In the email alert for the event, you can view the event timing based on the time zone selected by the analyst while scheduling the event, as well as the event location and URL.
Submit Event Requests
As a member, you can submit requests to schedule events to analysts for approval. All approved and published events appear in the events calendar.
Steps
To submit an event request, follow these steps:
In the Member Portal, click Events.
Click Submit Event Request. Use the following information while submitting event requests:
Basic Details: Enter the title and description of the event. This helps the analyst gain more insight into the event.
Event Schedule: Specify the timezone, date, time, location, and URL of the event. The default timezone is determined by your browser settings.
Preview: A preview of the event is displayed for your reference.
After entering the details, click Submit. Analysts can now view your request and based on approval, this event is published as an alert and will be available in the events calendar. You can also view the event alert in Alerts, where the alert category is Event.
If your event request is not approved, you can view this in Events History along with the comment from the analyst.